The real test of a project manager’s instinct is not how well they stick to a plan, but what they do when the numbers start drifting. How do I analyze performance variances in a project? That question sits at the intersection of data hygiene, schedule scrutiny, and human judgment. And it rarely arrives in a neat package. A cost overrun shows up first, but what hides underneath could be scope creep, a quality shortcut that’s already corroding team morale, or a flawed early estimate that nobody double‑checked. Variance analysis gives you a framework to decode these signals without getting lost in panic or politics. It is an after‑the‑fact look at what caused a difference between the baseline and the actual performance, but done well it becomes a forward‑looking diagnostic tool.
How to Analyze Performance Variances: Quick Summary
| Key Concept | Summary |
|---|---|
| Variance Analysis | A disciplined framework that interprets deviations between planned and actual performance, transforming variance from an alarm trigger into a strategic diagnostic asset. |
| Systematic Process | A phased methodology progressing from evidence verification through quantitative gap analysis to causal linkage, isolating true performance signals from statistical noise at each stage. |
| Data Quality | The foundational checkpoint that confirms completeness, coherence, and integrity of source data, ensuring variance insights rest on a reliable factual base rather than flawed inputs. |
| Earned Value Metrics | Quantitative measures such as cost variance (earned value minus actual cost) and schedule variance (earned value minus planned value) that ground performance discussions in objective evidence, replacing subjective judgment with calculable truth. |
| Baseline Integrity | When underlying assumptions dissolve, the original baseline distorts variance into phantom signals, indicating the need for rebaselining over misguided corrective attempts. |
| Context Variations | Methodology shapes application: PMBOK embeds variance analysis in Monitoring & Controlling, PRINCE2 situates it within Controlling a Stage, while Agile accepts scope as a variable and scrutinizes velocity stability and burn-down patterns. |
| Common Pitfalls | The trap of attributing cause or recalculating plans before validating data integrity can lead to constructing a recovery strategy on fabricated numbers, undermining any corrective effort. |
| Dual Nature | A positive deviation in one area often conceals negative trade-offs elsewhere; for example, an early finish achieved by compressing testing may silently escalate quality exposure. |
| Pattern Recognition | Analyzing variance trends over successive periods distinguishes systemic issues from isolated events, elevating the process from retrospective reporting to forward-looking intelligence. |
Steps to Analyze Performance Variances in a Project
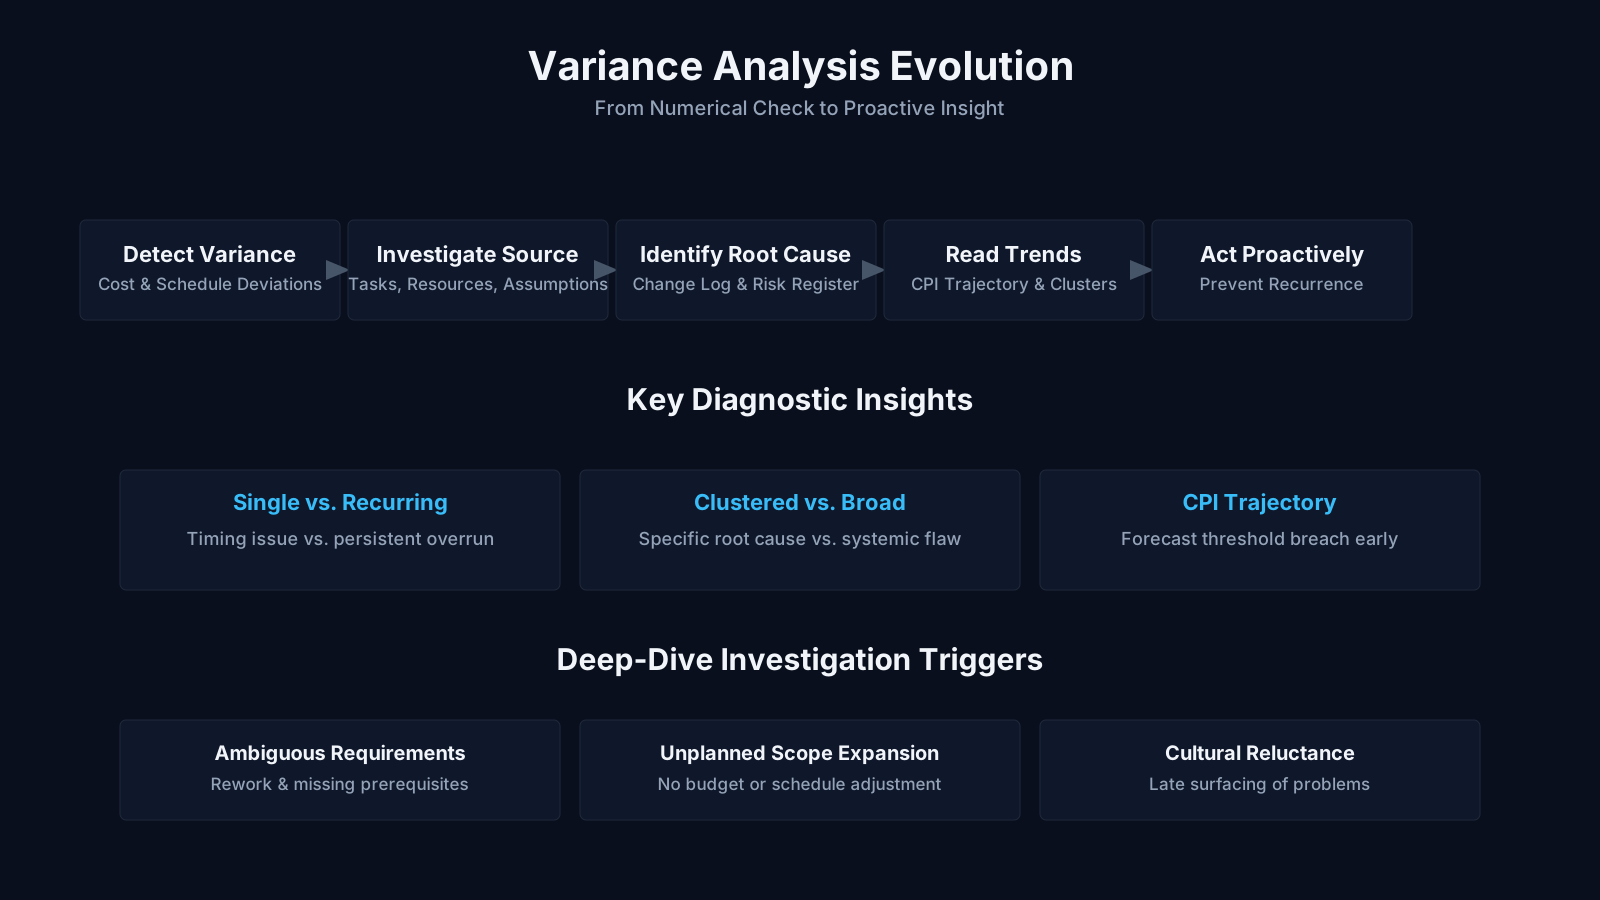
The core of a systematic variance analysis process is not a single calculation but a staged approach that moves from verifying evidence to linking cause and effect. You cannot jump straight to earned value metrics and expect insight. Doing so often buries the real story under a neat percentage. The common steps for performing variance analysis begin with confirming the reliability of your information, then quantifying differences against the baseline, assessing the wider impact on other project dimensions, and finally reading the patterns over time to see where the trajectory is heading. Each step leans on the previous one, so skipping ahead is like diagnosing an engine problem by only listening to the noise without opening the hood. The sequence forces you to separate noise from genuine deviation, a habit that seasoned program managers cultivate across every phase of delivery.
What trips many practitioners up is confusing the order of these activities. They might spot a cost variance and immediately try to assign blame, re‑estimate, or explain it away before checking whether the reported hours are even accurate. This is where the discipline of variance analysis saves you from your own reflex. The first layer of the process — verifying data quality — seems almost bureaucratic, but it is the gatekeeper that decides whether the numbers you react to are real or just ghosts from a timesheet error or a misapplied billing code. Only after that can you determine variances, applying earned value equations if the project has matured enough to track them, or simpler comparisons for smaller efforts. Then you interpret the consequences beyond the immediate metric, and finally you watch for patterns that might suggest something systemic rather than episodic.
In the PMBOK world, variance analysis sits inside the Monitoring and Controlling Process Group, closely tied to Control Costs and Control Schedule processes. It is not a standalone ritual but part of a larger feedback loop that informs change requests, corrective actions, and updates to the project management plan. PRINCE2 practitioners will recognize a parallel in the Controlling a Stage process, where the project manager reviews actuals against the stage plan and flags exceptions. Agile environments handle variance differently — they treat scope as a variable box that the team pulls into a sprint, so the concept of a fixed baseline morphs into a conversation about velocity stability and burn‑down trends. Yet the analytical mindset is transferable: you still need to verify the quality of data, spot deviations from expected throughput, and understand downstream impacts on the release plan. The mechanical steps remain universal even if the units of measurement change.
Verifying Data Quality for Accurate Variance Analysis
Before anyone can declare a variance meaningful, you have to pick apart the raw numbers. Data quality verification in variance analysis is the unglamorous step that separates seasoned project controllers from those who chase every financial ripple. The information collected must be complete — meaning all work packages have reported their actuals, not just the ones from teams that respond to reminders on time. It must be consistent with past data, so if one month’s cost data includes subcontractor markups and the previous month’s does not, you are comparing apples to furniture. And it must be credible when stacked against other project or status information, like informal conversations with team leads about what work actually got done. A reported progress of 40% on a construction component that nobody has seen a physical inspection report for is automatically suspect.
Credibility checks often surface some uncomfortable truths that nobody planned to discuss. A project financial system might show a task as 80% complete because the hours logged align with the budgeted amount, but the lead engineer knows the task is only half done and the remaining work is far more complex than originally estimated. The data mismatch signals not just a variance but a deeper estimation flaw. In those moments, pushing back on the data source is not obstruction; it is essential analysis. If you skip this verification and move straight to calculating cost performance indices, you risk basing your entire recovery plan on a lie dressed in a spreadsheet.
People sometimes assume that in smaller projects or in low‑ceremony teams, this step can be abbreviated. That assumption cracks when a minor overrun in a single sprint balloons into a release‑level delay because nobody caught the fact that a contractor logged work under the wrong cost code for three consecutive weeks. The effort to verify completeness and consistency scales, but the principle does not shrink. Even a brief cross‑check against team stand‑up notes, burn‑down charts, or procurement receipts can surface glaring inconsistencies before they harden into the “official” record. The most dangerous variance is the one you don’t analyze because you trusted the data without looking at it twice.
Determining Performance Variances Using Earned Value Management
Once you have clean data, the comparison against the baseline becomes a deliberate mathematical exercise, not a gut reaction. Earned value variance analysis gives you specific equations that quantify schedule and cost deviations with a precision that narrative reports cannot match. The cost variance is earned value minus actual cost, and the schedule variance is earned value minus planned value. A negative number tells you you’re behind plan in that dimension. These formulas look tidy, but what they really do is anchor the discussion so that no one can argue about opinions; they have to argue about the inputs. If the earned value figure is solid, the variance is an undeniable fact.
For projects not using full earned value management, determining variances still means placing actual information side by side with the baseline and noting every difference, both favorable and unfavorable to the project outcome. A task finished early but under‑budget is a favorable schedule variance but an unfavorable cost variance if extra resources were pulled in to accelerate it. This dual nature confuses stakeholders who only look for red numbers. A healthy variance review requires you to articulate that a “good” variance in one dimension sometimes masks a hidden problem in another. For instance, finishing ahead of schedule by cutting testing time might save weeks on paper but inject a quality risk that emerges months after deployment.
There is a subtle trap in the quantification step: the baseline itself. If the original baseline was built on assumptions that have since evaporated, the variance might look massive but actually be meaningless as a performance indicator. In those cases, variance analysis should trigger a discussion about rebaselining rather than just a corrective action. A seasoned program manager learns to distinguish between variances that reflect actual execution problems and variances that simply expose a broken planning foundation. The arithmetic does not make that distinction; human judgment does.
Impact Analysis: How Performance Variances Affect Project Objectives
Numbers without consequence are academic. The next layer of analysis pushes beyond the ratio and into the real‑world damage or opportunity. Impact of performance variances on cost and schedule is the obvious starting point, but a thorough review also examines quality performance adjustments and scope changes that might not yet be captured in the formal baseline. A schedule delay in a design review, for example, might seem minor until you map out the knock‑on effect on procurement lead times, which could in turn compress the commissioning window and force overtime costs. The variance itself is just the first domino; impact analysis is walking the line of dominoes to see which ones fall.
Quality often becomes the invisible casualty of variance pressure. When costs start creeping upward, teams might compensate by reducing inspection cycles or quietly accepting lower‑grade materials, actions that never appear in the cost variance report but gradually erode the deliverable’s integrity. A good impact analysis asks not just “what will this variance do to our schedule?” but also “what behaviors might this variance provoke in the team that will cause quality to degrade?” The source material explicitly mentions quality performance adjustments as a potential impact area, and it demands you look beyond the spreadsheet into the daily working norms that numbers cannot capture.
Scope changes flow from variance analysis in both directions. A budget overrun might force the project to shrink scope, which then has its own impact on benefit realization. Alternatively, discovering that a favorable cost variance exists because a scope element was quietly descoped without formal approval means the variance you’re celebrating is actually a scope‑change warning. Impact analysis should always loop back to the product scope statement to see whether what was delivered matches what was promised, because financial variances can hide scope drift that renders the entire project compliance‑questionable. This interconnectedness is why variance analysis cannot be performed in a silo by the finance team alone; it needs the technical leads and the product owner at the table.
Trend Analysis and Documenting Findings in Variance Reviews
Isolated variances are like a single fever reading — they tell you something but not the whole story. Trend analysis in project variances takes the current deviation and places it against a sequence of past reports to see whether the gap is growing, shrinking, or oscillating. A persistent negative cost variance that worsens each month signals a structural problem. A spike that immediately returns to near‑zero might be a one‑off vendor billing error. The temporal pattern often reveals more about the source of variation than the absolute magnitude of the latest number. If you skip trending, you risk treating a systemic underestimation issue with a one‑time budget transfer, only to see the same pattern re‑emerge two reporting periods later.
Documenting findings about the sources of variation and the impact area is not just bureaucratic housekeeping. It becomes the memory of the project, and more importantly, the memory of the organization. When a similar project is launched two years later, the variance analysis archive can prevent the same estimation mistakes from being baked into a new baseline. The act of writing down causes — not just symptoms — forces an honesty that verbal discussions often avoid. Instead of recording “cost overrun due to supplier delay,” a good note digs into the root: “Procurement lead‑time assumptions were based on pre‑pandemic norms and were not adjusted for current logistics volatility.” That specificity turns variance analysis from a control tool into a learning asset.
Trends can also surface positive deviations that become competitive advantages. If a team consistently finishes complex deliverable ahead of schedule with stable quality, the trend data might reveal a process innovation worth scaling. Variance analysis that only hunts for problems misses these opportunities. A mature review meeting starts with the unfavorable variations, yes, but then pivots to the favorable ones and asks what conditions created them and whether they can be replicated. The documentation then includes not just variance figures but the contextual factors that produced them, building a richer knowledge base than any lessons‑learned workshop conducted months after the fact.
Core Insights on Variance Analysis
- Staged sequential process
- Variance analysis proceeds through a structured workflow: first, verify the factual basis of the figures; next, measure the magnitude and direction of deviations; then, assess their ripple effects on objectives; and finally, interpret recurring patterns to forecast performance.
- Data quality is gatekeeper
- Data integrity serves as the critical gatekeeper, because only after confirming that reported numbers are complete, consistent, and credible can analysts develop recovery plans that address root causes instead of chasing phantom variances.
- Resist premature judgment
- Practitioners must refrain from assigning blame or re-estimating until they have confirmed that the underlying data are accurate, because jumping to conclusions buries the real story beneath neat percentages and leads to misguided corrective actions.
- Universal analytical mindset
- While methodologies such as PMBOK, PRINCE2, and Agile define and measure variance using distinct techniques, the fundamental discipline of verifying data quality and identifying deviations remains universally applicable across all delivery approaches.
Common Missteps in Variance Analysis
One of the most frustrating habits I see is rushing to the ”what happened” before confirming the ”what is.” Variance analysis pitfalls often start with accepting reported hours or costs at face value without verifying that the person entering the data actually understood the task coding structure. In matrix organizations, a specialist might work on five different projects in a week and, under pressure, allocate all their time to the first project that opened a timesheet. The resulting variance shows a massive over‑run on that project and an under‑run on the others, sparking unnecessary replanning meetings while the real work pattern remains invisible. A short verification call or a glance at concurrent project logs can prevent this entire mess.
Another frequent error is treating variance as inherently negative. A favorable cost variance of 15% sounds like a win until you dig in and realize the team skipped an approval step that will cause a regulatory audit finding later. Project environments that punish any deviation from the baseline end up training people to hide variances rather than surface them for analysis. The psychological effect is profound: team members learn to game the reporting system, shifting charges between work packages to create the illusion of on‑target performance, which then starves the project of the early warning signals that variance analysis is meant to provide. The tool becomes useless not because it fails but because the culture prevents honest reporting.
Many practitioners also misapply the thresholds. Not every variance needs a full impact analysis. A $200 overspend on a $50,000 work package is a rounding error, not a crisis. Setting clear tolerance levels — perhaps expressed as a percentage of the line item budget or as an absolute dollar value — prevents analysis paralysis. The risk is that teams swing to the opposite extreme and ignore early faint signals that, when trended, show a steady crawl toward a breach. The sweet spot is a tiered response: minor variances get noted and trended, moderate ones trigger a quick root cause check, major ones launch the full four‑step analysis. Without that calibration, variance analysis becomes either a monster that eats every status meeting or a forgotten checkbox on a dashboard nobody reads.
Linking Variance Analysis to Broader Project Management Frameworks
The steps for analyzing performance variances are not invented in isolation; they sit within a well‑mapped landscape of project management standards. PMBOK variance analysis process explicitly positions this as a technique used in Control Costs and Control Schedule, relying on work performance data and the project management plan to generate work performance information that informs decisions. It feeds directly into change requests, updates to project documents, and eventually into lessons learned. The phrase “analyze performance variances” is not a standalone activity; it is the bridge between raw monitoring data and the judgment calls that keep a project viable.
PRINCE2 embeds a similar discipline through its management by exception principle, where the project board sets tolerances for each stage. When actual performance threatens to breach those tolerances, the project manager produces an exception report that effectively is a structured variance analysis. The difference is that PRINCE2 pre‑defines who makes decisions based on the variance magnitude, escalating from project manager to project board to corporate or programme management, whereas PMBOK leaves governance escalation as a project‑specific design. In both cases, the analytical underpinning — verifying data, comparing to baseline, assessing impact — remains remarkably consistent, which tells you the practice has survived because it works across methodologies.
Agile and lean contexts treat variance as a signal about process stability rather than a deviation from a fixed scope‑and‑cost contract. A team that finishes a sprint with only half the story points it committed to is experiencing a throughput variance, and the retrospective becomes the natural forum for the same four‑step analysis: Is the data clean? Were there estimation inconsistencies? What is the impact on the release plan? What is the trend over the last three sprints? The toolset morphs into cumulative flow diagrams, control charts, and lead‑time histograms, but the mental model is identical. Recognizing this common thread prevents the tired argument that variance analysis is a waterfall relic; it is simply a logical diagnostic routine that adapts to whatever currency a project uses to measure progress.
Key Insights Across Variance Frameworks
- PMBOK variance analysis role
- PMBOK anchors variance analysis in the Control Costs and Control Schedule processes, using performance data and the project management plan to trigger change requests and capture actionable lessons learned.
- PRINCE2 exception-based escalation
- PRINCE2's management by exception requires project managers to generate structured exception reports immediately upon tolerance breaches, and it prescribes predefined escalation paths based on variance magnitude to accelerate resolution.
- Consistent analytical foundation
- Both PMBOK and PRINCE2 follow an identical analytical routine of verifying data, comparing it to the baseline, and assessing impact, confirming that this disciplined approach delivers reliable insights regardless of methodology.
- Agile variance as process signal
- In Agile and Lean contexts, variance acts as a signal of process stability, and teams employ retrospectives along with flow-based tools such as cumulative flow diagrams and control charts to perform the same diagnostic routine, embedding continuous improvement into delivery.
The BVOP Perspective on Process Damage and Variance Waste
Where traditional variance analysis focuses on cost and schedule deviations, a modern business‑value‑oriented lens adds a dimension that many project managers miss: the invisible organizational harm that poor practices create. BVOP business value point tracking introduces the concept of “process damage,” which refers to the waste generated when teams overwork documents, chase perfectionism on unvalidated features, or reject perfectly acceptable work, all in the name of quality. These activities rarely show up as a variance on a standard earned value report, but they consume effort and extend lead times just the same. A comprehensive performance variance analysis, then, should ask whether a schedule delay was caused by real scope work or by process waste that could be eliminated.
BVOP’s approach also tracks “Business Value Points,” a holistic measure that can decline persistently even when cost performance looks healthy. If a favorable cost variance is achieved by deferring a high‑value feature, the financial metric reports a win while the value metric reports a loss. The trend analysis step becomes crucial here: if business value points are dropping across multiple reporting periods while schedule variance remains neutral, the project may be drifting toward a condition where closure should be considered, not because it is over budget, but because it is no longer delivering enough value to justify continuation. This adds a layer that traditional variance analysis frameworks don’t explicitly address but that practitioners increasingly need to incorporate when reporting to value‑focused sponsors.
Another BVOP insight applies to the data quality verification step. When team‑created tools or open‑source software are treated as formal products, the data about their development effort might be scattered across personal logs, chat messages, and fragmented repositories. Verifying completeness and consistency becomes harder, and the analysis must actively hunt for undocumented work that nonetheless contributes to the baseline’s deliverables. Ignoring these non‑standard work sources is a common blind spot. The variance you think exists might simply be the shadow of useful work that was never captured in the official tracking system, a reminder that variance analysis has to extend its reach into how teams actually operate, not just how the project management office expects them to operate.
Making Variance Analysis a Habit, Not a Reaction
The most reliable projects build variance analysis into the rhythm of the work, not just into crisis moments. Continuous variance monitoring means setting a cadence — weekly, bi‑weekly, or at the end of every sprint — where the four steps are executed with enough discipline that small deviations surface before they compound. When teams only analyze variances at the monthly governance review, the lag between data collection and insight can be three weeks, by which time the actual situation on the ground has shifted entirely. The analysis then becomes a historical autopsy rather than a live diagnostic.
Embedding this habit requires making the data collection as painless as possible. If the project relies on manual spreadsheets that must be collated from seven different subcontractors, the verification step alone will consume a full day and erode the will to perform analysis at all. Automation, dashboards that pull from integrated work management tools, and standardized cost codes are not just efficiency plays; they are enablers of high‑quality variance analysis. When the friction drops, people analyze more often, spot trends earlier, and document findings in a living narrative rather than in a panic report rushed out before a steering committee presentation.
An often‑overlooked side effect of regular variance analysis is the psychological safety it can create. When the conversation shifts from “who caused this overspend?” to “what pattern are we seeing and how do we adapt?,” teams start volunteering early warnings instead of hiding them. The analysis becomes a shared exploration rather than a blame allocation exercise. That shift alone can yield more reliable variance data, because people stop manipulating the numbers to look good and start reporting what they actually see. The loop closes: better data, better impact assessments, better trend detection, and ultimately better project outcomes. That is the quiet power behind a process that, on the surface, looks like a simple comparison of actuals to baseline.
Core Insights on Analysis Cadence
- Continuous variance monitoring cadence
- Conducting variance analysis on a weekly, biweekly, or sprint-end cadence reveals small deviations early, while monthly reviews frequently arrive too late, reducing the analysis to a postmortem rather than a forward-looking diagnostic.
- Low-friction data collection enables frequency
- Automation, integrated dashboards, and standardized cost codes streamline data collection, enabling teams to analyze more often, detect trends sooner, and maintain a continuously updated narrative instead of scrambling for a last-minute damage report.
- Psychological safety shifts the conversation
- Frequent variance analysis reframes the conversation from blaming for overspends to discerning patterns and adjusting, which encourages teams to raise early warnings voluntarily rather than concealing risks.
- Better data closes the feedback loop
- When people report actual conditions without adjusting figures, variance analysis yields sharper impact assessments and trend detection, ultimately driving stronger project outcomes.
