The Cost Performance Index, abbreviated as CPI, is a core earned value management metric that indicates the cost efficiency of project work by comparing the value of work actually completed to the actual costs spent producing that work. A CPI of 1.0 means the project is exactly on budget, a CPI greater than 1.0 signals that more value has been earned than money spent, and a CPI below 1.0 indicates a cost overrun. It is one of the most widely used quantitative indicators for cost control in predictive and hybrid project environments.
Cost Performance Index: Key Topics at a Glance
| Key Concept | Summary |
|---|---|
| CPI Definition | Cost Performance Index quantifies cost efficiency as the ratio of earned value to actual cost. Values above 1.0 indicate favorable cost performance, while values below 1.0 signal that work is consuming more budget than planned. |
| Comparison Utility | Because earned value and actual cost are both monetary inputs, CPI produces a dimensionless ratio. This allows direct benchmarking across projects, phases, work packages, and contract types without unit conversion. |
| Historical Roots | CPI originated within large defense acquisition programs and was institutionalized through the Cost/Schedule Control Systems Criteria and later the ANSI/EIA-748 Earned Value Management Systems standard. |
| Other Applications | The underlying principle of comparing achieved value to consumed resources also informs manufacturing cost accounting, construction progress measurement, and engineering performance reviews, often expressed through industry specific productivity metrics. |
| Construction Practice | Quantity surveyors commonly compare the value of completed work against project costs and drawdowns. This practice parallels CPI logic even when the formal term is not applied in day to day construction reporting. |
| Compliance Reporting | Government agencies, aerospace contractors, and large infrastructure programs rely on CPI as a core element of compliance driven earned value reporting, frequently linked to contractual thresholds and variance analysis requirements. |
| Industry Differences | The interpretation and use of CPI vary by sector, shaped by accounting standards, contracting models, and the maturity of the performance measurement baseline. These factors influence how thresholds are set and how variances are escalated. |
| Agile Challenges | Agile teams manage scope through evolving backlogs and relative estimation, which limits the feasibility of detailed earned value planning at the task level and shifts performance focus toward iteration level value delivery. |
What Is Cost Performance Index? Definition and Core Meaning
The Cost Performance Index definition in project management refers to a ratio that expresses cost efficiency as the relationship between earned value and actual cost. The formula is CPI equals earned value divided by actual cost, often written as CPI = EV / AC. Earned value represents the budgeted value of work actually accomplished, while actual cost represents the total expenditures incurred for that same work. Because both values are expressed in monetary units, the resulting index is dimensionless and allows straightforward comparison across projects, phases, or work packages.
Interpreting the CPI is fairly direct at the surface level. A CPI of 1.0 indicates that the project is spending exactly what it planned to spend for the value delivered. A CPI above 1.0 means the project is achieving more earned value than the cost being consumed, which many practitioners describe as being under budget or cost-efficient. A CPI below 1.0 indicates that actual costs are outpacing earned value, meaning the project is over budget relative to the work completed. The metric does not determine whether a project is successful overall, but it provides a reliable early signal of cost performance problems.
What often surprises newer project managers is that CPI is not a measure of total budget spent. It measures cost efficiency against the value actually earned, not against the overall budget. A project could have spent only thirty percent of its total budget but still have a CPI below 1.0 if the work completed was worth less than what was spent. That distinction is central to understanding why CPI is more diagnostic than a simple budget burn rate.
Core Insights on CPI Fundamentals
- CPI formula and definition
- The Cost Performance Index (CPI) is calculated as earned value divided by actual cost, yielding a ratio that measures how efficiently project funds are being converted into completed work.
- Dimensionless comparison metric
- Since earned value and actual cost share the same monetary unit, CPI functions as a dimensionless ratio that allows project performance to be compared consistently across different projects, phases, and work packages.
- Interpreting CPI values
- A CPI of 1.0 indicates that spending is exactly aligned with the value delivered; values above 1.0 reflect favorable cost efficiency, while values below 1.0 warn that actual costs are exceeding the value generated.
- Diagnostic early warning tool
- Rather than measuring overall project success, CPI serves as a dependable early warning indicator of cost performance issues, offering more diagnostic value than a straightforward budget burn rate.
Origins and Cross-Industry Context of Cost Performance Index
The origins of Cost Performance Index lie in the earned value management methods developed by the United States Department of Defense in the 1960s. These methods grew out of the need to track both schedule and cost performance in large defense acquisition programs where traditional actual-versus-budget comparisons were insufficient. The Cost/Schedule Control Systems Criteria, later normalized in standards such as the ANSI/EIA-748 standard, formalized the use of earned value, actual cost, and related indices including CPI.
Outside project management, the underlying logic of comparing achieved value to consumed resources appears in manufacturing cost accounting, construction progress measurement, and engineering performance reviews. In construction, for example, quantity surveyors often assess the value of completed work against drawdowns and incurred costs, which parallels CPI logic even when the specific term is not used. Government agencies, aerospace contractors, and large infrastructure programs continue to rely on CPI as part of compliance-driven earned value reporting.
The cross-industry adoption of CPI matters because it demonstrates that the metric is not a software-development fad or a narrow PMBOK invention. The concept migrated from defense into oil and gas, information technology, and public sector programs. Yet the way CPI is interpreted and acted upon differs across industries depending on accounting rules, contracting models, and the maturity of the organization's performance measurement baseline.
Key Components and Calculation of Cost Performance Index
Understanding the key components of Cost Performance Index requires a clear grasp of earned value and actual cost. Earned value is the authorized budget assigned to work that has actually been completed, while actual cost is the realized cost incurred for that completed work. In formal earned value management, these values are accumulated at the control account or work package level and rolled up to project level for executive reporting.
The calculation itself is simple arithmetic, but the inputs demand disciplined planning and accounting. If a work package has an approved budget of fifty thousand dollars and half of that work has been completed on a physical progress basis, the earned value would be twenty-five thousand dollars. If the project spent thirty-five thousand dollars to achieve that progress, then CPI equals twenty-five thousand divided by thirty-five thousand, or approximately 0.71. That means the project is spending about one dollar and forty cents for every dollar of value earned.
One nuance often lost in basic training is that CPI can be calculated on a cumulative basis or for a specific period. Cumulative CPI reflects cost efficiency from the start of the project through the current reporting date, which tends to stabilize as more data accumulates. Period CPI, also called current CPI, isolates efficiency during a single reporting period and is more volatile. Mature project controls teams look at both numbers because cumulative CPI can hide recent deterioration that period CPI exposes.
Core Insights on CPI Calculation
- Earned value and actual cost
- Earned value represents the authorized budget allocated to work that has been completed, while actual cost captures the expenditures actually incurred in delivering that completed scope.
- Data aggregated at control accounts
- Within a formal earned value management system, cost and schedule data are aggregated at the control account or work package level before being consolidated at the project level for executive reporting.
- Illustrative CPI calculation example
- For example, a work package with a budget of fifty thousand dollars that is fifty percent complete has earned twenty-five thousand dollars in value; if thirty-five thousand dollars has been spent, the resulting CPI is approximately 0.71.
- Cumulative versus period CPI
- Cumulative CPI measures overall cost efficiency from project initiation to the current reporting date and gradually stabilizes as data volume increases, whereas period CPI isolates performance within a single reporting interval and therefore shows greater volatility.
- Monitor both CPI metrics
- Experienced project controls teams monitor both metrics because cumulative CPI can mask recent performance declines that period CPI makes immediately visible.
Cost Performance Index in PMBOK and Earned Value Management
The Cost Performance Index in PMBOK is presented as an output of earned value analysis within the Control Costs process. In the sixth edition of the PMBOK Guide, Control Costs belongs to the Monitoring and Controlling Process Group and the Project Cost Management Knowledge Area. The PMBOK Guide defines CPI as a measure of the cost efficiency of budgeted resources, expressed as the ratio of earned value to actual cost.
PMI's practice standard for earned value management goes further and positions CPI as part of a broader performance measurement system that includes planned value, earned value, actual cost, schedule variance, cost variance, and the related schedule and cost indices. Within this system, CPI is a lagging indicator because it reports what has already happened, but it feeds into leading indicators through forecasting formulas and trend analysis. The PMBOK Guide also links CPI to variance analysis, performance reviews, and the development of corrective actions during project execution.
In the seventh edition of the PMBOK Guide, the focus shifts to principles and performance domains rather than prescriptive processes, but earned value analysis and CPI remain valid tools within the Delivery and Measurement performance domains. Practitioners who work in organizations aligned with PMI standards continue to use CPI as a standard element of status reports, stage gate reviews, and financial forecasting, even when the methodology language has evolved.
Cost Performance Index in PRINCE2 and Other Frameworks
The Cost Performance Index in PRINCE2 is not a mandatory metric, but it fits naturally within the Progress theme and the Controlling a Stage process. PRINCE2 emphasizes management by exception, baselines, and tolerance, all of which benefit from objective measures of cost efficiency. While PRINCE2 does not prescribe earned value management in detail, project managers often use CPI alongside forecast reports and end stage assessments to demonstrate whether actual costs align with delivered value.
In PRINCE2, the project board reviews actuals against plan at stage boundaries, but simple actual-versus-budget comparisons do not reveal whether the money spent produced the expected amount of work. CPI resolves that weakness by matching cost to earned value. This makes it particularly useful when a project is under budget but also behind schedule, because the CPI will not automatically look favorable if the earned value is low relative to cost spent.
Other frameworks such as ISO 21508, which addresses earned value management in project and programme management, treat CPI as a standard performance indicator. Large capital programs often align their internal methods with such standards to ensure consistent, auditable reporting across contractors and international delivery teams.
Core Takeaways on CPI Adoption
- CPI fits PRINCE2 naturally
- Although PRINCE2 does not mandate CPI, the metric integrates naturally with the Progress theme and the Controlling a Stage process because it connects cost tracking to earned value.
- Supports management by exception
- Objective cost-efficiency measures such as CPI strengthen PRINCE2's reliance on baselines, tolerances, and exception-based oversight by providing a quantitative trigger for management intervention.
- Paired with stage assessments
- Project managers frequently combine CPI with forecast reports and end stage assessments to verify that actual spending corresponds to the value actually delivered at each stage boundary.
- Exposes hidden value gaps
- CPI addresses the blind spot of simple actual-versus-budget comparisons by matching cost to earned value, which is particularly valuable when a project is spending less than planned but still falling behind schedule.
- Standard in other frameworks
- ISO 21508 and similar standards recognize CPI as a core performance indicator, and large capital programs rely on it to maintain consistent, auditable reporting across multiple contractors and international teams.
Cost Performance Index in Agile and Hybrid Environments
Using the Cost Performance Index in Agile environments requires adaptation because traditional earned value management assumes a stable, well-defined baseline that agile delivery intentionally avoids. Agile teams typically manage scope through backlogs, relative estimation, and short iterations, which makes formal planning of earned value at a detailed task level difficult. However, at a release or project level in hybrid settings, CPI can still provide useful cost efficiency signals.
In a fixed-price agile engagement, the sponsor commits to a budget while the team refines scope incrementally. Earned value can be approximated by assigning business value or story point completion to the agreed scope, and actual cost is drawn from team burn rates and capitalized labor. CPI then shows whether the team is delivering enough value relative to that cost. The calculation may be less precise than in construction, but it can still alert leadership to early financial drift.
A common misconception is that agile teams do not care about cost performance. In reality, agile methods emphasize value and sustainable pace, but the organization funding the work still monitors budget efficiency. CPI in a hybrid environment bridges that gap, combining agile delivery evidence with classical financial oversight. The key is to avoid forcing detailed earned value tracking into every sprint; instead, CPI is often reviewed at program increments or release boundaries.
BVOP Perspective on Cost Performance Index
The BVOP perspective on Cost Performance Index recognizes that cost efficiency alone does not equal value delivery. Business Value-Oriented Project Management treats value as the primary measure of success and would therefore pair CPI with value-based indicators rather than using cost efficiency in isolation. A project could have a CPI above 1.0 while producing limited business value, especially if the earned value calculation reflects completed work that stakeholders later reject or do not use.
BVOPM also introduces the concept of process damage, which refers to invisible organizational harm that may not appear in earned value or CPI. A team might deliver work efficiently in cost terms while accumulating technical debt, burning out staff, or creating defects that surface later. The CPI would look healthy in the interim, which is why BVOPM encourages monitoring broader performance signals. The method's focus on waste reduction also cautions against treating favorable CPI as an automatic sign of good management.
Key Takeaways on Value-Driven CPI
- CPI alone does not guarantee value
- A project can show CPI above 1.0 while delivering limited business value when stakeholders reject or fail to adopt the completed work, which is why BVOP pairs CPI with value-based indicators instead of relying on cost efficiency in isolation.
- Process damage hides from CPI
- BVOP introduces the concept of process damage to describe invisible organizational harm, including technical debt, staff burnout, and latent defects, which earned value and CPI calculations do not capture and which typically surface only later.
- Favorable CPI still warrants caution
- BVOP's emphasis on waste reduction cautions that a favorable CPI does not automatically signal sound management, so broader performance indicators should be monitored alongside CPI.
Purpose and Importance of Cost Performance Index in Project Management
The importance of Cost Performance Index lies in its ability to provide an objective, early warning signal about financial efficiency before a project reaches a point of no return. Unlike raw budget consumption, CPI connects spending directly to what has been accomplished, which makes it far more meaningful for sponsors and governance boards. A project that has spent eighty percent of its budget but earned only forty percent of its value is in serious trouble, and CPI exposes that condition quickly.
CPI also supports forecasting. A widely used estimate at completion formula divides the budget at completion by CPI to project the likely total cost if current efficiency continues. That forecast, even when approximate, gives decision makers a factual basis for approving corrective actions, requesting additional funding, or resetting expectations. Without CPI, discussions about budget forecasts often become subjective negotiations based on optimism rather than performance data.
The metric is particularly important in large programs where financial exposure is high and accountability is distributed across multiple vendors or departments. In such settings, CPI can be calculated at project, work package, or control account level, enabling leaders to identify specific areas of poor cost performance rather than applying blanket budget reductions. That granularity is one of the reasons CPI remains a staple in government and defense programs.
How Cost Performance Index Is Used in Practice
In real project work, Cost Performance Index in practice appears in monthly status reports, steering committee dashboards, and stage gate reviews. Project controllers calculate CPI after actual costs are recorded and progress is measured, usually at the end of each reporting period. The result is compared against a threshold, often 0.90 or 0.95, depending on organizational tolerance, and any breach triggers a variance analysis and corrective action plan.
Practical use often includes examining the trend of CPI over several periods rather than reacting to a single data point. A CPI that drops from 1.05 to 0.92 over three months signals emerging cost inefficiency even if the cumulative value remains above 1.0. Project managers also pair CPI with the schedule performance index to distinguish between cost problems and schedule problems. For example, a project that is behind schedule may show favorable CPI simply because less work was completed and therefore less cost was incurred, which can create a misleading sense of financial health.
Forecasting with CPI usually involves the assumption that future performance will resemble past performance. The estimate at completion can be calculated as the budget at completion divided by CPI, which provides a realistic projection when current cost efficiency is expected to continue. Some teams use a composite index that combines cost and schedule factors to refine the forecast. In practice, experienced practitioners treat these projections as scenarios rather than precise predictions, updating them as new performance data arrives.
Key Insights on Practical CPI Use
- Periodic calculation against thresholds
- Project controllers calculate the cost performance index after each reporting period and compare it with organizational thresholds, typically 0.90 or 0.95, so that any breach triggers variance analysis and corrective action.
- Trend analysis over single points
- Experienced practitioners track CPI trends over successive reporting periods instead of reacting to a single value, because a three-month slide from 1.05 to 0.92 can signal emerging inefficiency even while the cumulative index remains above 1.0.
- Pairing CPI with schedule performance
- Project managers review CPI alongside the schedule performance index to distinguish cost overruns from schedule delays, since a project that is behind schedule may still show a favorable CPI merely because less work has been completed and therefore less cost has been incurred.
- Forecasting via EAC calculation
- The estimate at completion, derived by dividing the budget at completion by the current CPI, gives teams a realistic cost projection that is best treated as a planning scenario rather than a definitive forecast, with the figure revised as each new performance period closes.
Common Challenges, Pitfalls, and Misconceptions About Cost Performance Index
One of the most persistent common misconceptions about Cost Performance Index is that a CPI of 1.0 or higher means the project is healthy. Cost efficiency is only one dimension of project success. A project can be under budget and still fail to meet scope, quality, schedule, or stakeholder expectations. CPI also does not reveal whether the earned value itself is accurate, which depends on honest progress measurement and credible baseline planning.
Data quality is a significant practical challenge. If earned value is overstated because progress has not been objectively verified, CPI will look artificially favorable. Conversely, if actual costs are not fully loaded or are allocated incorrectly, CPI may understate or overstate cost efficiency. Organizations with weak time tracking, poor work breakdown structure discipline, or inconsistent accounting practices often derive CPI values that lead to wrong conclusions.
Another pitfall is overreacting to period CPI volatility. Early in a project, small variances in either earned value or actual cost can produce large swings in the index, making a single period CPI unreliable. Some practitioners also game the metric by delaying cost capture or accelerating low-value work to boost earned value, which temporarily improves CPI without improving real project outcomes. These behaviors highlight why CPI must be reviewed alongside qualitative performance evidence and not treated as a standalone verdict.
Cost Performance Index vs Schedule Performance Index and Other EVM Metrics
The comparison of Cost Performance Index vs Schedule Performance Index often confuses people new to earned value management. CPI measures cost efficiency, while the schedule performance index, or SPI, measures schedule efficiency as the ratio of earned value to planned value. They are complementary but distinct. A project can have CPI above 1.0 and SPI below 1.0, meaning it is spending less than earned but completing work later than planned.
CPI is also related to cost variance, which is the difference between earned value and actual cost. Cost variance is expressed in monetary units, while CPI is a ratio. A project with a cost variance of negative ten thousand dollars could have different CPI values depending on the scale of the project. The ratio form makes CPI more useful for comparing efficiency across projects of different sizes or across phases with different budgets.
Another commonly confused metric is the to-complete performance index, or TCPI, which indicates the cost efficiency required on remaining work to meet a specific financial goal. Unlike CPI, which describes past performance, TCPI is forward-looking and often more demanding when current performance has been poor. A project with a CPI of 0.85 may need a TCPI above 1.0 for the remainder of the project to stay within the original budget, a fact that reframes the seriousness of the current inefficiency.
Core Insights on EVM Metrics
- CPI versus SPI definitions
- The Cost Performance Index quantifies cost efficiency by comparing earned value to actual cost, while the Schedule Performance Index assesses schedule efficiency by comparing earned value to planned value.
- Independent CPI and SPI values
- A project can simultaneously post a CPI above 1.0 and an SPI below 1.0, which signals that it is generating more value than it is spending while completing deliverables behind schedule.
- CPI compared to cost variance
- Cost variance states the difference between earned value and actual cost in currency units, whereas CPI normalizes that relationship as a ratio, enabling meaningful efficiency comparisons across projects of different sizes.
- TCPI is forward-looking
- The to-complete performance index defines the cost efficiency that remaining work must achieve to meet a specific financial target, giving it a forward-looking orientation that contrasts with the CPI's retrospective view of past performance.
- TCPI demands after poor performance
- If a project's CPI has slipped to 0.85, the TCPI required to keep the original budget may exceed 1.0, underscoring the magnitude of the efficiency gains needed for the remaining work.
Relationships to Other Project Management Concepts
Exploring Cost Performance Index relationships within the broader project management ecosystem reveals its dependence on the performance measurement baseline. The baseline integrates scope, schedule, and cost, and CPI cannot be meaningful unless that baseline is reasonably accurate and maintained through formal change control. Poor baseline definition undermines CPI because earned value calculations rely on approved budget assignments to work packages and control accounts.
CPI connects directly to variance analysis, trend analysis, and forecasting tools. Project managers use CPI alongside cost variance, schedule variance, estimate at completion, and estimate to complete to build a coherent picture of project performance. In risk management, a deteriorating CPI may trigger review of cost reserves and contingency drawdowns. The metric also feeds decision making in change control, where sponsors must judge whether requested changes are affordable given current cost efficiency.
At a governance level, CPI is a component of portfolio performance reporting. Portfolio managers may compare CPI values across active projects to identify those consuming disproportionate resources relative to earned value. This does not mean CPI is a value measure; it is a cost efficiency measure. Value may be tracked separately through benefits realization metrics, customer satisfaction, or strategic alignment scores.
Evolution and Current Thinking on Cost Performance Index
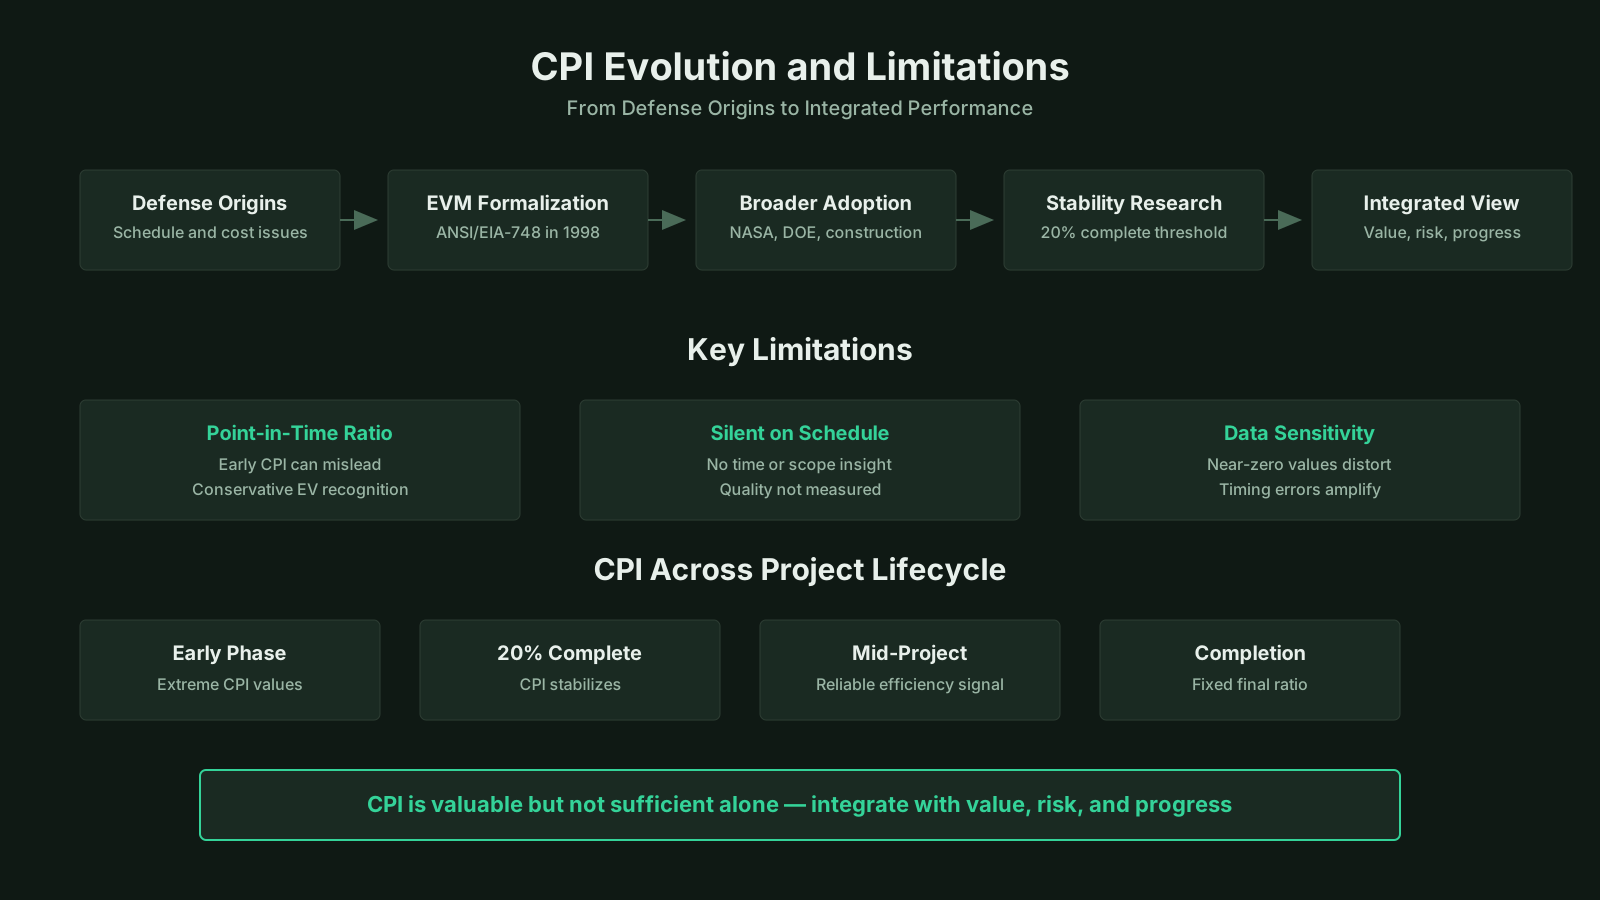
The evolution of Cost Performance Index reflects a shift from rigid compliance reporting toward more nuanced performance management. Early earned value systems focused on satisfying government reporting requirements, often at the expense of practical usefulness. Over time, project managers learned that CPI becomes more stable after the first fifteen to twenty percent of a project is complete, which led to the cumulative CPI stability rule and more realistic expectations about early index volatility.
Current thinking recognizes that CPI is useful but incomplete. Organizations increasingly combine CPI with earned schedule, risk-based forecasts, and value delivery indicators. There is ongoing debate about the accuracy of the standard estimate at completion formula based on CPI, because it assumes future cost performance will mirror the past. In volatile environments, that assumption breaks down and may require probabilistic forecasting or scenario planning instead.
Many practitioners also question the direct application of CPI in agile or highly uncertain work. Some argue that strict earned value measurement conflicts with agile principles, while others advocate for a lightweight earned value approach at the release level. The most credible position today is pragmatic: CPI remains a valuable cost efficiency index when a disciplined baseline exists, but it should be integrated with value, risk, and progress measures rather than presented as the single source of truth about project performance.
Key Insights on CPI Evolution
- Shift from compliance to performance
- Cost performance index practices have moved beyond rigid government reporting obligations and now function as a flexible management instrument that project managers actively use to guide daily execution decisions.
- CPI stability after project start
- Field evidence indicates that the cumulative CPI stabilizes after roughly the first fifteen to twenty percent of project execution, which gave rise to the cumulative CPI stability rule and helps teams interpret early volatility as a predictable phase rather than a warning sign.
- CPI seen as useful but incomplete
- High performing organizations now pair CPI with earned schedule, risk adjusted forecasts, and value delivery indicators because cost efficiency alone cannot reveal whether a project is delivering outcomes that justify its budget.
- EAC formula assumptions questioned
- The standard estimate at completion formula built on CPI remains contested because it assumes future cost performance will mirror past performance, an assumption that rarely survives volatile environments and increasingly leads practitioners toward probabilistic forecasting and scenario based planning.
- Pragmatic integration wins out
- The most defensible position today treats CPI as a valuable cost efficiency index when a disciplined baseline exists, while integrating it with value, risk, and progress measures instead of presenting it as the single source of truth.
