Cost variance in project management is defined as the difference between the value of work actually accomplished, known as earned value, and the actual cost incurred to perform that work. The standard formula is CV = EV - AC. A positive cost variance indicates that the project has earned more value than it has spent, while a negative cost variance signals that actual spending exceeds the value delivered.
Cost Variance: Key Topics at a Glance
| Key Concept | Summary |
|---|---|
| Cost Variance Definition | Cost variance measures the net difference between earned value and actual cost at the status date, quantifying whether completed work is over or under budget. |
| Interpreting Variance Direction | Positive cost variance indicates the project generated more value than it consumed, whereas negative cost variance reveals that expenditures outpaced the value earned to date. |
| Cost Performance vs. Budget Status | Negative cost variance can occur even when total spending remains under the original budget if the earned value of completed work falls below the actual cost incurred for that work. |
| Origins of Earned Value Management | Earned value management originated in United States defense acquisition programs during the 1960s as a method for providing objective, integrated cost and schedule control metrics on large scale projects. |
| Linear Progress Measurement | For work with linear progress, earned value is calculated by multiplying percent complete by the budget at completion; for example, a $10,000 package at 30 percent complete has earned value of $3,000. |
| Timing Distortions in Cost Data | Cost variance loses reliability when accruals, supplier invoices, or internal labor charges are recorded in a different period than the corresponding work, creating timing distortions that misrepresent true performance. |
| Labor-Hour and Level-of-Effort Packages | Progress measurement for labor-hour and level-of-effort packages is inherently less precise, making cost variance highly sensitive to minor adjustments in the reported percent complete. |
| PRINCE2 Cost Tolerances | PRINCE2 addresses this control challenge by setting stage and project level cost tolerances; when actual spending deviates beyond these agreed boundaries, exceptions are escalated for corrective action. |
What Is Cost Variance?
In formal terms, cost variance definition is the arithmetic difference between earned value and actual cost at a specific status date or point in time. The concept does not compare total budget to total spend. It compares the budgeted value of completed work to the actual amount paid for that work. That distinction matters because a project can show a negative cost variance even when total expenditures remain below the original budget if the work actually completed is worth less than what was spent to complete it.
Cost variance is expressed in the currency unit of the project, such as dollars, euros, or pounds. The two inputs are derived from the project plan and from financial records. Earned value is often called the budgeted cost of work performed, while actual cost is the realized cost of work performed. Planned value does not appear in the cost variance formula, even though it is essential for schedule variance and for understanding the overall performance picture.
Imagine a project with a $50,000 control account. At the status date, the team has completed 40 percent of that account and should have earned $20,000. Accounting records show $24,000 spent. The cost variance is negative $4,000. The team spent four thousand dollars more than the value it produced, even though the total spend is still far below the overall account budget. This is the kind of distinction that makes cost variance useful as an early warning measure.
Earned value management, the broader discipline in which cost variance sits, emerged from United States defense acquisition programs in the 1960s. The practice later spread to construction, aerospace, energy, and public infrastructure. In those industries, cost variance became a standard control metric because large projects need objective data to separate pricing problems from delivery problems.
Cost Variance Core Insights
- Definition at status date
- At the status date, cost variance is the arithmetic difference between earned value and actual cost, expressed in the project's reporting currency such as dollars, euros, or pounds.
- Completed work versus actual cost
- Instead of comparing the total budget to total spend, this metric compares the budgeted value of work actually completed with the actual amount paid to complete that work.
- Negative variance despite low spending
- A negative cost variance can arise even when cumulative spending remains below the original budget, because the value of work completed may be less than what was spent to complete it.
- Planned value omitted from formula
- Although the inputs come from project planning and financial records, planned value is intentionally excluded from the cost variance formula even though it remains essential for schedule variance and overall performance analysis.
Key Components of Cost Variance
Understanding the key components of cost variance requires a clear view of earned value, actual cost, and the control account structure that supports them. Earned value depends on objective progress measurement, not on the team's subjective sense of completion. Without a reliable method to quantify physical progress, the metric becomes guesswork and the resulting variance loses meaning.
Earned value represents the authorized budget assigned to work that has been completed. It is not the amount invoiced or the amount spent. A work package worth $10,000 earns $10,000 only when the completion criteria for that package have been met. If the package is 30 percent complete, the earned value is $3,000, assuming progress is measured linearly and that linear assumption matches the work type.
Actual cost represents all realized expenditures directly attributable to the work performed. It includes labor, materials, equipment, subcontractor charges, and other direct costs as defined by the project's accounting practices. The timing of actual costs matters. Accruals, delayed supplier invoices, and internal labor charges can distort the view if they are not recorded in the same period as the corresponding work.
Earned Value and Actual Cost
Cost variance cannot be interpreted without knowing whether progress figures are reliable. In lump-sum work packages, progress is often based on milestone completion, which gives clean earned value. In labor-hour or level-of-effort packages, progress measurement may be less precise, and small changes in percent complete can swing cost variance substantially.
Interpreting Positive and Negative Values
A positive cost variance may look like good news, but it can also reveal planning errors, scope reduction, or under-reporting of costs. A negative cost variance may indicate genuine overspending, but it can also reflect poor estimating, scope additions, or delayed invoices. The raw number is a starting point for investigation, not a conclusion about project health.
Cost Variance in PMBOK and Earned Value Management
The PMBOK Guide positions cost variance within the Control Costs process, which belongs to the Project Cost Management knowledge area and the Monitoring and Controlling Process Group. In this context, cost variance PMBOK guidance treats CV as a work performance information output derived from work performance data through variance analysis.
In the PMBOK framework, cost variance is one of several earned value metrics used to assess cost performance. The Control Costs process receives work performance data from project execution and transforms it into information that supports change requests, forecast updates, and corrective actions. Cost variance is not a planning metric; it is a monitoring and controlling metric that depends on an approved cost baseline.
The formula appears in the Project Cost Management chapter of the PMBOK Guide under the earned value analysis technique. PMBOK also defines related indices, including the cost performance index, which is the ratio of earned value to actual cost. Cost performance index normalizes cost variance for scale, making it easier to compare performance across projects of different sizes.
Role in Monitoring and Controlling
Within PMBOK, cost variance is analyzed alongside schedule variance, cost performance index, and schedule performance index. Project managers use these combined indicators to determine whether a problem is driven by pricing, productivity, scope changes, or schedule delays. That distinction guides the selection of corrective actions.
Earned Value Cost Variance Essentials
- Monitoring and controlling metric
- Cost variance functions as a work performance information output within the Control Costs process, enabling project managers to evaluate actual cost performance against the approved cost baseline and separate execution efficiency from planning assumptions.
- Variance analysis transformation
- Variance analysis converts raw work performance data generated during project execution into actionable information, giving project teams the evidence needed to justify change requests, refine forecasts, and implement targeted corrective actions.
- Normalized performance comparison
- The cost performance index expresses earned value as a ratio of actual cost, creating a measure that is independent of project scale and allows cost efficiency to be compared meaningfully across projects, portfolios, or reporting periods of different sizes.
- Combined indicator diagnosis
- Analyzing cost variance together with schedule variance and the schedule performance index helps project managers isolate whether cost deviations originate from resource pricing, productivity shortfalls, uncontrolled scope expansion, or cascading schedule delays.
Cost Variance in PRINCE2 and Other Frameworks
PRINCE2 does not use cost variance as a standalone earned value metric, but the underlying concern is reflected in its tolerance and exception management controls. In a PRINCE2 environment, cost variance in PRINCE2 is not expressed as CV = EV - AC, but the same concern is managed through stage and project cost tolerances, with exceptions escalated when actual or forecast spending deviates beyond agreed boundaries.
PRINCE2 manages projects through stages and uses highlight reports, checkpoint reports, and end stage reports to compare actual costs with planned costs. The project board sets cost tolerances, and the project manager has authority to operate within those limits. A negative deviation does not automatically trigger an exception; it triggers an exception only when it is projected to breach tolerance.
Other frameworks handle the concept similarly without always naming it. ISO 21500 includes earned value management as a technique within project control. The Association for Project Management also recognizes earned value and cost variance as standard performance measures. This broad acceptance means the metric is not limited to PMBOK-based environments.
Cost Variance in Agile and Hybrid Environments
In pure agile delivery, cost variance is often less visible as a formal earned value calculation because work is not usually measured in monetary earned value. However, cost variance in agile projects can be approximated by comparing the cost of delivered product increments against their accepted business value or by applying agile earned value management at the release level.
Agile teams typically track progress through burn-up charts, burn-down charts, cumulative flow diagrams, and velocity. These tools reveal schedule and scope trends more readily than cost variance. Yet the underlying question remains: is the team delivering enough value for the money being spent? When an organization needs a cost-based answer, it may assign monetary values to story points or completed features.
Hybrid projects often combine a predictive business case and budget with agile delivery at the team level. In those settings, cost variance may be calculated only at major milestones or at the end of a release, using actual capital and operating costs against the value of completed product increments. This is less frequent than monthly EVM reporting in traditional projects, but it still provides a cost performance check.
Core Takeaways for Agile Cost Variance
- Limited formal earned value
- Agile delivery rarely applies formal earned value calculations because completed work is seldom quantified in monetary terms, which limits direct cost variance measurement.
- Approximating cost variance
- Cost variance in agile environments is typically approximated by comparing the cost of delivered increments with the business value accepted by stakeholders, or by applying agile earned value management selectively at the release level.
- Agile tracking tools
- Burn-up charts, burn-down charts, cumulative flow diagrams, and velocity provide clearer insight into schedule and scope trends than direct cost variance, making them more practical for routine agile tracking.
- Hybrid milestone checks
- In hybrid projects, a predictive budget coexists with agile delivery, so cost variance is typically calculated at major milestones or at the end of each release by comparing actual costs against the value of completed product increments.
Purpose and Importance of Cost Variance
The primary importance of cost variance is its role as an early indicator of cost performance before final budget outcomes are locked. Because it compares delivered value with actual cost, it reveals not only overspending but also situations where the project is spending the right amount yet delivering too little value.
Cost variance helps project managers separate cost problems from schedule problems. A project can be ahead of schedule and still have a negative cost variance if work is being performed inefficiently. Conversely, a project can be behind schedule with a positive cost variance if it has earned more than it spent, perhaps by deferring work or booking favorable supplier terms. The metric alone does not tell the story, but it directs attention to the right place.
For sponsors and governance bodies, cost variance provides a consistent, objective measure across phases and projects. It supports forecasting through the estimate at completion and to-complete performance index, and it feeds trend analysis over successive reporting periods. A single negative value means little. A worsening trend over three or four periods is a stronger signal.
Calculating and Interpreting Cost Variance in Practice
In practice, cost variance calculation occurs at the work package or control account level during regular status reviews, usually monthly or at the cadence of the project's reporting cycle. The calculation itself is simple, but interpretation requires context about the nature of the work, the accuracy of progress reporting, and the timing of cost accruals.
Most organizations calculate cost variance only after the cost baseline has been approved and a reliable system for progress measurement exists. Work packages are assigned budget values, and progress is recorded as a percentage complete or through milestone achievement. Actual costs are drawn from the accounting system, ideally in the same period as the progress data. If data sources are not synchronized, the variance can be misleading.
Variance thresholds are commonly set to trigger management attention. A small cost variance may be accepted as normal, while a variance beyond a defined percentage or dollar amount requires root cause analysis. Thresholds vary by project size and risk. A $5,000 variance on a $100,000 work package is far more significant than the same dollar variance on a $10 million control account.
Root Cause Analysis and Corrective Direction
When cost variance is negative, the investigation typically examines labor productivity, material prices, scope changes, rework, or underestimation. When it is positive, the review looks for planning errors, missed work, unrecorded costs, or favorable market conditions. The goal is not to punish the team but to correct the planning or execution conditions that produced the variance.
Key Insights on Cost Variance
- Calculation timing and prerequisites
- Cost variance is calculated at the work package or control account level during periodic status reviews, once the cost baseline has been approved and a dependable system is in place to record progress and actual costs within the same reporting period.
- Context determines variance significance
- The significance of a cost variance depends on the scale of the work involved, because a $5,000 variance on a $100,000 work package indicates a materially larger issue than the same dollar amount on a $10 million control account.
- Thresholds trigger root cause investigation
- Organizations define variance thresholds that separate normal fluctuations from issues requiring analysis, with negative variances triggering a review of productivity, materials, scope changes, or rework, and positive variances prompting checks for planning errors, missed work, or unrecorded costs.
Common Challenges, Pitfalls, and Misconceptions
A common cost variance misconception is that a negative value simply means the project is over budget. More precisely, it means actual cost exceeds earned value at the status date. The project may still be under its total budget, but poor efficiency today can signal a larger problem later.
Another misconception is that cost variance measures the difference between planned value and actual cost. That is not correct. Planned value is the budgeted cost of work scheduled, not the budgeted cost of work performed. Confusing the two produces a variance that mixes schedule and cost issues into one number, which defeats the purpose of earned value analysis.
Data quality is the most frequent practical challenge. Percent complete estimates are often subjective, especially for knowledge work such as software development or design. If a work package is reported as 80 percent complete for several weeks, the earned value is overstated, and cost variance looks better than reality. Similarly, delayed invoices or prepayments can distort actual cost.
Cost variance should not be used in isolation, and it is not appropriate for every project. Very small projects, projects without a stable scope baseline, or projects with highly uncertain work may gain little from formal cost variance calculation. In those situations, simpler burn reporting or milestone tracking may be more useful.
Cost Variance vs Schedule Variance and Cost Performance Index
The relationship between cost variance vs schedule variance is one of the most useful diagnostic views in earned value management. Cost variance and schedule variance are both expressed in currency units and share earned value as a common input, but they measure different dimensions of performance.
Schedule variance is calculated as earned value minus planned value. It answers whether the project has earned more or less value than scheduled at the status date. Cost variance is earned value minus actual cost. It answers whether the project has earned more or less value than it spent. A project can have a positive schedule variance and a negative cost variance, meaning it is ahead of schedule but spending inefficiently.
Cost performance index, often abbreviated CPI, is the ratio of earned value to actual cost. It is scale-independent and useful for comparing performance across work packages or projects. A CPI below 1.0 corresponds to a negative cost variance, while a CPI above 1.0 corresponds to a positive cost variance. Many practitioners emphasize CPI over cost variance because a ratio communicates efficiency more intuitively than a dollar amount.
Using cost variance and schedule variance together can distinguish four basic conditions: on schedule and under budget, on schedule and over budget, behind schedule and under budget, and behind schedule and over budget. Each condition points to a different set of corrective actions. No single metric should guide project decisions.
Key Takeaways on Variance Metrics
- Shared input, different dimensions
- Cost variance and schedule variance both stem from earned value and are expressed in currency units, yet they illuminate distinct aspects of project performance: cost efficiency and schedule adherence.
- Schedule variance calculation
- Schedule variance is calculated by subtracting planned value from earned value, indicating whether the project has accumulated more or less value than expected at the status date.
- Ahead of schedule yet overspending
- A project may simultaneously report a positive schedule variance and a negative cost variance, a combination that reveals work is ahead of schedule while resources are being consumed inefficiently and calls for cost-focused corrective action.
- CPI as efficiency ratio
- The cost performance index is derived by dividing earned value by actual cost, yielding a scale-independent ratio that enables practitioners to compare cost efficiency consistently across work packages, phases, or entire projects.
Evolution and Current Thinking on Cost Variance
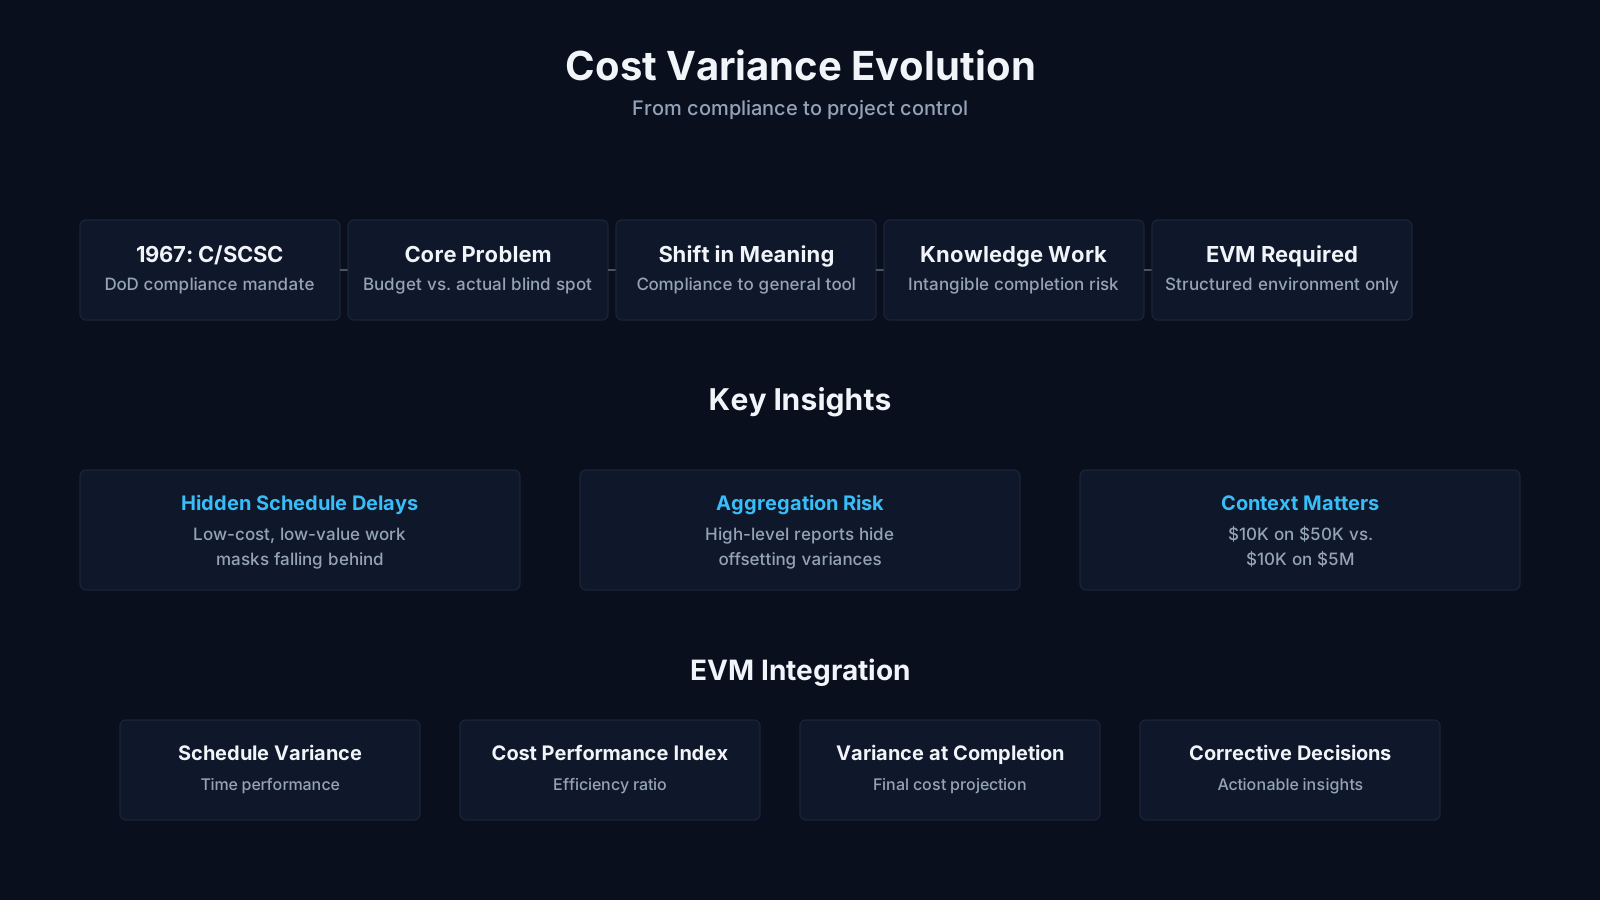
The evolution of cost variance as a project control metric tracks the broader adoption of earned value management from its defense origins into construction, software, energy, and public infrastructure. Early usage emphasized compliance reporting, while modern practice places greater weight on trend analysis, forecasting, and integration with risk data.
Earned value management was formalized in United States government acquisition policy during the 1960s and later standardized in the ANSI/EIA-748 guidelines. Cost variance was one of the required metrics for contractors on large defense programs. Over time, the practice spread to private industry, where project managers adapted it to smaller and more varied project environments.
Current debates center on whether earned value management is too rigid for adaptive environments. Critics argue that arbitrary percent complete figures can give a false sense of precision in knowledge work. Supporters respond that cost variance remains valuable when progress is defined by objective completion criteria and when the metric is used as a trend indicator rather than a precise accounting statement.
Modern project controls increasingly combine cost variance with risk registers, change logs, and probabilistic forecasting. Rather than treating a single monthly cost variance as a verdict, practitioners track cumulative cost variance and cost performance index over time and use those trends to update estimate at completion forecasts. This shift has moved the metric from a compliance requirement toward a decision support tool.
Cost Variance in BVOP and Value-Based Methods
Business value-oriented project management treats persistent negative cost variance as one possible signal of deeper value delivery problems rather than as an isolated accounting failure. Within this perspective, cost variance in BVOP practice is linked to business value points, process damage, and waste categories such as overwork, perfectionism, and rejected acceptable work.
BVOPM does not discard earned value management, but it places cost variance within a broader value-monitoring framework. A project may produce acceptable cost variance while still damaging the organization through invisible process harm or declining business value points. Conversely, a negative cost variance may be tolerated temporarily if it reflects deliberate investment in quality or team capability that will reduce future risk.
From this viewpoint, cost variance is useful only when it connects to value trade-offs. A negative variance caused by unnecessary perfectionism is treated differently from one caused by material price escalation. The first suggests waste, the second suggests an external risk that requires a funding or scope response.
Key Takeaways on BVOP Cost Variance
- Variance as value delivery signal
- In BVOP, persistent negative cost variance serves as an early indicator of compromised value delivery rather than a mere accounting discrepancy.
- Waste and process damage links
- BVOP links cost variance directly to business value points, process damage, and identifiable waste categories such as overwork, perfectionism, and the rejection of otherwise acceptable work.
- EVM within broader monitoring
- BVOPM retains earned value management while embedding cost variance inside a broader framework that monitors value delivery and organizational impact.
- Variance alone is insufficient
- A project can report acceptable cost variance yet still inflict organizational damage through hidden process waste or falling business value points, while a temporary negative variance may be justified when it funds deliberate improvements in quality or team capability.
- Trade-offs make variance useful
- Cost variance becomes useful only when anchored to value trade-offs, so a negative variance driven by unnecessary perfectionism indicates waste, while one driven by material price escalation points to an external risk that calls for a funding or scope adjustment.
