In project, program, and portfolio management, the Benefit-Cost Ratio is defined as a financial metric that compares the relative magnitude of anticipated benefits to the costs required to achieve them, expressed as a single numeric index. A ratio greater than 1.0 indicates that benefits outweigh costs, while a ratio below 1.0 signals that the investment is financially unattractive on a purely quantitative basis. The term is also widely referenced as the cost-benefit ratio, though the preferred order in disciplined project management is benefit first, to reinforce the primacy of value delivery over expense. Unlike metrics that measure net value in absolute currency units, the Benefit-Cost Ratio normalizes the relationship between gains and expenditures, making it especially useful for comparing projects of vastly different scales.
Summary Table: Benefit-Cost Ratio
| Key Concept | Summary |
|---|---|
| Definition | A financial metric that expresses the ratio of total anticipated benefits to total costs, providing a single numeric indicator of value generation in project, program, and portfolio management. |
| Normalized Metric | By normalizing expected gains against costs, the ratio enables scale-independent comparisons, allowing decision-makers to rank projects of any size on a consistent value basis. |
| PMBOK Context | Within the PMBOK Guide’s business case framework, the Benefit-Cost Ratio serves as a benefit measurement method that directly supports project selection and go/no-go authorization decisions. |
| Historical Origins | Originating in welfare economics and public policy analysis, the ratio was first developed to assess large infrastructure and environmental initiatives whose benefits extend beyond direct market transactions. |
| Government Adoption | Mid-twentieth-century government agencies, particularly in water resources and transportation, adopted the ratio to substantiate expenditures on public goods that offered no immediate revenue stream. |
| Public Private Tension | A tension arises when the public sector’s inclusion of non-monetary social benefits conflicts with private sector expectations for quantifiable financial returns, complicating cross-sector project comparisons. |
| Key Components | Constructing a reliable ratio depends on three core elements: systematic identification and valuation of benefits, comprehensive aggregation of all relevant costs, and careful selection of a discount rate that reflects the time value of money and risk. |
| Modern PMBOK | PMBOK 7th Edition shifts from prescribing specific metrics to emphasizing the value delivery system; here, the Benefit-Cost Ratio serves as a key indicator linking project outputs to strategic objectives and organizational value attainment. |
Definition and Core Meaning of the Benefit-Cost Ratio
The precise Benefit-Cost Ratio definition in project management contexts centers on dividing total discounted benefits by total discounted costs over the relevant analysis period. The numerator captures all positive cash flows, revenue enhancements, cost savings, and sometimes monetized intangible gains that are attributable to the project outcome. The denominator aggregates all one-time and recurring costs, including capital expenditures, operational expenses, maintenance, and sometimes decommissioning outlays. Because these cash flows occur at different points in time, both sides of the equation are adjusted using a discount rate that reflects the time value of money and the organization’s cost of capital. The resulting figure is unitless, a simple quotient, which makes it immediately interpretable across different domains and project types.
Within the broader business case development process prescribed by the Project Management Institute’s PMBOK Guide, the Benefit-Cost Ratio is categorized as a benefit measurement method designed to support project selection and authorization. It is explicitly mentioned in the Develop Project Charter process under Project Integration Management. The metric answers the fundamental question of whether a project returns more value than it consumes, but does so in a proportional rather than an absolute sense. For example, a Benefit-Cost Ratio of 2.4 means that for every monetary unit invested, the organization can expect 2.4 units of benefit in return, measured in present value terms. The metric does not reveal the total scale of the net return, only the efficiency of the investment.
PRINCE2, the structured project management methodology originating in the UK, embeds the Benefit-Cost Ratio within its Business Case theme, where it serves as one of several investment appraisal techniques. While PRINCE2 does not mandate a specific financial metric, practitioners commonly employ BCR alongside net present value and payback period analyses. The methodology emphasizes that the ratio must be recalculated at key decision points throughout the project life cycle, not merely at initiation, to ensure continued justification. This ongoing viability assessment distinguishes a mature application of the tool from a one-off gatekeeping exercise.
Origins and Cross-Industry Context
The Benefit-Cost Ratio traces its intellectual roots to welfare economics and public policy analysis, where it was originally developed to evaluate large-scale infrastructure and environmental projects that produce non-market benefits. Government agencies, particularly in water resource management and transportation planning, adopted the technique in the mid-twentieth century to justify expenditures where direct revenue generation was absent. The underlying logic was to translate diffuse societal gains, such as reduced flood damage, improved health outcomes, and time savings, into monetary equivalents so they could be weighed against taxpayer funds. From these origins, the tool migrated into corporate finance and ultimately into project portfolio management, where it now applies to everything from new product development to internal process improvements.
Outside project management, the Benefit-Cost Ratio remains a cornerstone of regulatory impact analysis, public health interventions, and environmental assessments. In medicine, for instance, health economists compute cost-effectiveness ratios, a close cousin, to evaluate treatments. In manufacturing, capital budgeting committees use BCR to rank competing equipment purchases. This broad adoption lends the metric a certain credibility, but also carries an inherent tension: the public-sector tradition of incorporating non-monetary social benefits can clash with the private-sector demand for hard financial returns. Project managers who understand this provenance are better equipped to explain why certain intangible benefits are included or excluded from the ratio in their particular organizational context.
Key Insights on the Benefit-Cost Ratio
- Discounted benefits divided by costs
- The ratio divides total discounted benefits (positive cash flows and savings) by total discounted costs (capital, operating, and maintenance expenditures), with both aggregates discounted using a rate that accounts for the time value of money.
- Unitless quotient with practical meaning
- As a dimensionless metric, a BCR of 2.4 indicates that the project is expected to generate 2.4 units of present-value benefit for every monetary unit invested, offering a direct, comparative gauge of value creation across different initiatives.
- Origins in welfare economics
- Emerging from welfare economics to assess public infrastructure and environmental projects, the BCR is classified in the PMBOK Guide as a benefit measurement method for project selection, although its social-benefit orientation can diverge from private-sector priorities that emphasize financial returns.
Key Components of the Benefit-Cost Ratio
Deconstructing the key components of the Benefit-Cost Ratio reveals three foundational building blocks: the identification and valuation of benefits, the comprehensive aggregation of costs, and the selection of an appropriate discount rate. Benefits are not simply revenue. They encompass cost avoidance, productivity gains, quality improvements, risk reduction, and sometimes enhanced brand equity or employee retention, provided these can be reliably quantified. In project management, benefits are typically classified as tangible or intangible. Tangible benefits, such as reduced material waste or higher sales volume, enter the numerator directly. Intangible benefits are often excluded or treated as supplementary justification unless the organization has established a defensible monetization methodology.
Costs, on the other hand, are usually easier to pin down but are frequently underestimated. The denominator must capture the full life cycle cost of the project output, not just the initial development expense. This includes implementation costs, training, change management, ongoing support, license renewals, and eventual sunsetting. A project that appears highly favorable based on build costs alone can become a net drain when maintenance and operational overheads are factored in over five or ten years. The time horizon chosen for the analysis directly shapes the ratio; shorter periods may understate long-term benefits, while excessively long horizons introduce forecasting uncertainty.
The discount rate is the component that most often becomes a point of contention. It reflects the organization’s minimum acceptable rate of return, or the weighted average cost of capital, and serves to translate future cash flows into present values. A higher discount rate penalizes projects whose benefits are backloaded, making them look less attractive. Conversely, a low discount rate favors long-term initiatives. Because even small adjustments to the rate can flip a project’s BCR from acceptable to unacceptable, practitioners must document the rationale clearly and test sensitivity to rate changes. Understanding these three components as an integrated system, rather than isolated variables, is critical to interpreting any Benefit-Cost Ratio correctly.
Benefit-Cost Ratio in Project Management Frameworks
The placement of Benefit-Cost Ratio in PMBOK lies primarily within Project Integration Management, specifically as a tool in the Develop Project Charter process and as part of the business case development that feeds into project initiation. In the PMBOK Guide Sixth Edition, the Benefit-Cost Ratio is listed among benefit measurement methods, alongside economic models such as net present value, internal rate of return, and payback period. The seventh edition, with its principles-based approach, does not prescribe specific financial metrics but reinforces the performance domain of delivery of value, where BCR naturally resides as one way to demonstrate alignment between project outputs and strategic goals. Portfolio management, also governed by PMI standards, uses BCR extensively during component selection and prioritization, often in combination with scoring models and bubble diagrams.
PRINCE2 integrates the Benefit-Cost Ratio within the Business Case theme, which operates as a living document throughout the project life cycle. The methodology requires that the project board approve the business case at initiation and revisit it at each stage boundary. The BCR is recalculated to reflect updated cost estimates, realized benefits from early deliverables, and any changes in the external environment that affect the value proposition. In a PRINCE2 environment, the ratio is never treated as a static approval hurdle but as a health indicator that signals whether continued investment is warranted. This dynamic use contrasts with some predictive environments where the BCR is computed once, filed, and forgotten.
In Agile and hybrid delivery paradigms, the Benefit-Cost Ratio does not disappear, but it morphs in application. Agile teams working within a program structure often evaluate epics or features using a lightweight Cost of Delay Divided by Duration metric, which shares philosophical DNA with BCR by weighing value against investment. Large-scale Agile frameworks such as SAFe incorporate economic prioritization principles that call for calculating a BCR or similar value-to-cost ratio at the portfolio level. The key adaptation is that costs are not estimated upfront for an entire two-year project but for smaller, just-in-time increments. Benefits are likewise decomposed, allowing the ratio to be recalculated as the team learns more about what customers actually value. This iterative approach reduces the risk of committing to a project whose initial BCR was based on faulty assumptions.
BVOP and Value-Oriented Adaptation
Business Value-Oriented Project Management (BVOPM) extends the conventional Benefit-Cost Ratio logic by insisting that non-financial program benefits, such as employee engagement improvements and future risk reduction, be formally recognized in value assessments. Where a standard BCR might disregard these as unquantifiable, BVOPM demands they be captured at least qualitatively, and ideally through quantified proxies, so that the ratio more fully reflects the organizational value thesis. Additionally, BVOPM’s concept of program “realization sets” allows individual projects within a program to choose their own methodologies, which means a BCR calculated for an Agile delivery stream may coexist with a differently modeled BCR for a predictive infrastructure project under the same program umbrella.
Key Takeaways on BCR in Frameworks
- BCR anchored in PMBOK integration
- Embedded in Project Integration Management, the Benefit-Cost Ratio serves as a key business case tool during the Develop Project Charter process, evolving from a prescribed financial metric in the Sixth Edition to a robust demonstration of value delivery in the Seventh Edition.
- Portfolio prioritization and dynamic recalculation
- Portfolio managers rely on BCR alongside scoring models to select and sequence components, and they continuously recalculate the ratio to reflect updated cost estimates, realized benefits, and shifting external conditions; PRINCE2, notably, treats the BCR as an ongoing health indicator rather than a static approval hurdle.
- Agile adaptations and BVOPM extensions
- Agile frameworks such as SAFe apply value-to-cost ratios at the portfolio level to align initiatives with strategic goals, while BVOPM extends BCR logic by formally incorporating non-financial benefits and allowing projects within a program to adopt distinct BCR models through its realization sets concept.
Purpose and Importance of Benefit-Cost Ratio
The purpose and importance of the Benefit-Cost Ratio extend well beyond a simple go/no-go gate. In portfolio management, it serves as a common denominator for ranking candidate projects that differ dramatically in scope, domain, and resource requirements. A portfolio manager cannot meaningfully compare a $50,000 automation project with a $10 million new facility simply by looking at net present value, the larger project will almost always produce a bigger absolute number. The BCR levels the playing field by showing efficiency of investment, so that a small process improvement yielding a 3.5 BCR may be prioritized over a massive infrastructure program that only returns 1.2. This capacity for cross-scale comparison makes the metric indispensable in organizations that face more good ideas than they have funding.
The ratio also communicates project value in terms that resonate with finance departments and executive steering committees. Senior leaders rarely scrutinize project plans in detail, but they do understand a ratio that clearly signals “we expect to get back two dollars and fifty cents for every dollar we spend.” This clarity reduces friction during budget approval cycles and builds sponsor confidence. In program management, aggregating BCR across related projects can provide a composite value picture, though one must be cautious: ratios are not arithmetically additive, meaning the BCR of a program is not the average of its component project BCRs but must be recalculated from aggregated cash flows.
Another purpose, often understated, is that the discipline of constructing a Benefit-Cost Ratio forces a rigor that exposes hidden assumptions. When teams must assign monetary values to expected benefits, they quickly uncover gaps in their logic. An expected efficiency gain of “20 percent faster processing” means little until it is translated into labor cost savings or revenue acceleration. The act of building the ratio therefore serves as a de facto challenge session, surfacing wishful thinking before it hardens into a project charter. This diagnostic function is arguably as valuable as the final numeric output.
Practical Application of Benefit-Cost Ratio
In real project work, practical application of the Benefit-Cost Ratio most commonly begins during pre-initiation feasibility studies or business case development, where project sponsors and business analysts construct the initial cash flow projections. The ratio is then presented as part of a project charter or similar authorization document to the project sponsor and governance body. A typical scenario would involve a company considering whether to replace a legacy ERP system. The team models implementation costs, including software licenses, consulting fees, internal staff time, and temporary productivity dips during transition, against expected benefits such as reduced manual reconciliations, faster monthly closing cycles, and lower maintenance fees on the old system. The resulting BCR of, say, 2.8 becomes a pivotal data point in the decision package.
The ratio does not retire after approval. In predictive environments with formal stage gates, the project manager and the sponsor should revisit the BCR at phase reviews, particularly if the business case assumptions have shifted. A common mistake is to treat the BCR as a frozen artifact. If a key cost driver doubles during execution, or if a competitor’s move erodes the expected revenue uplift, the ratio should be recalculated to determine whether the project still deserves its current priority. In Agile contexts, the BCR is often recalculated per increment or per minimum viable product release, with the product owner and stakeholders assessing whether the remaining backlog still promises a favorable value-to-cost ratio.
The audiences that use the Benefit-Cost Ratio span from project managers and business analysts to portfolio managers, PMO directors, and external auditors. Each has a different lens. The PMO may mandate a standardized BCR calculation template to ensure consistency across the portfolio. External auditors, especially in regulated industries, may review the assumptions behind the ratio to confirm that governance followed due process. In construction and public infrastructure projects, the BCR is often a required element in the funding application, with specific guidelines on which benefits can be counted and which discount rates must be applied. Knowing these audience expectations prevents rework and challenges later.
Core Takeaways on BCR Application
- Origins in feasibility studies
- The Benefit-Cost Ratio originates in pre-initiation feasibility studies and business case development, and is then embedded in project charters to inform sponsors and governance bodies.
- Legacy ERP replacement example
- A typical legacy ERP replacement scenario weighs implementation costs such as licenses, consulting, and temporary productivity dips against benefits like faster monthly close cycles and lower maintenance fees, often yielding a favorable ratio of 2.8.
- Ratio requires periodic reassessment
- In stage-gate environments, the BCR should be recalculated at each phase review when assumptions shift, because an unchanged ratio may conceal whether a project still merits priority after cost overruns or market changes.
- Agile recalculation per release
- In Agile settings, the BCR is recalculated for each increment or minimum viable product release, allowing the product owner and stakeholders to judge whether the remaining backlog continues to offer a favorable benefit-to-cost outcome.
Common Challenges and Misconceptions
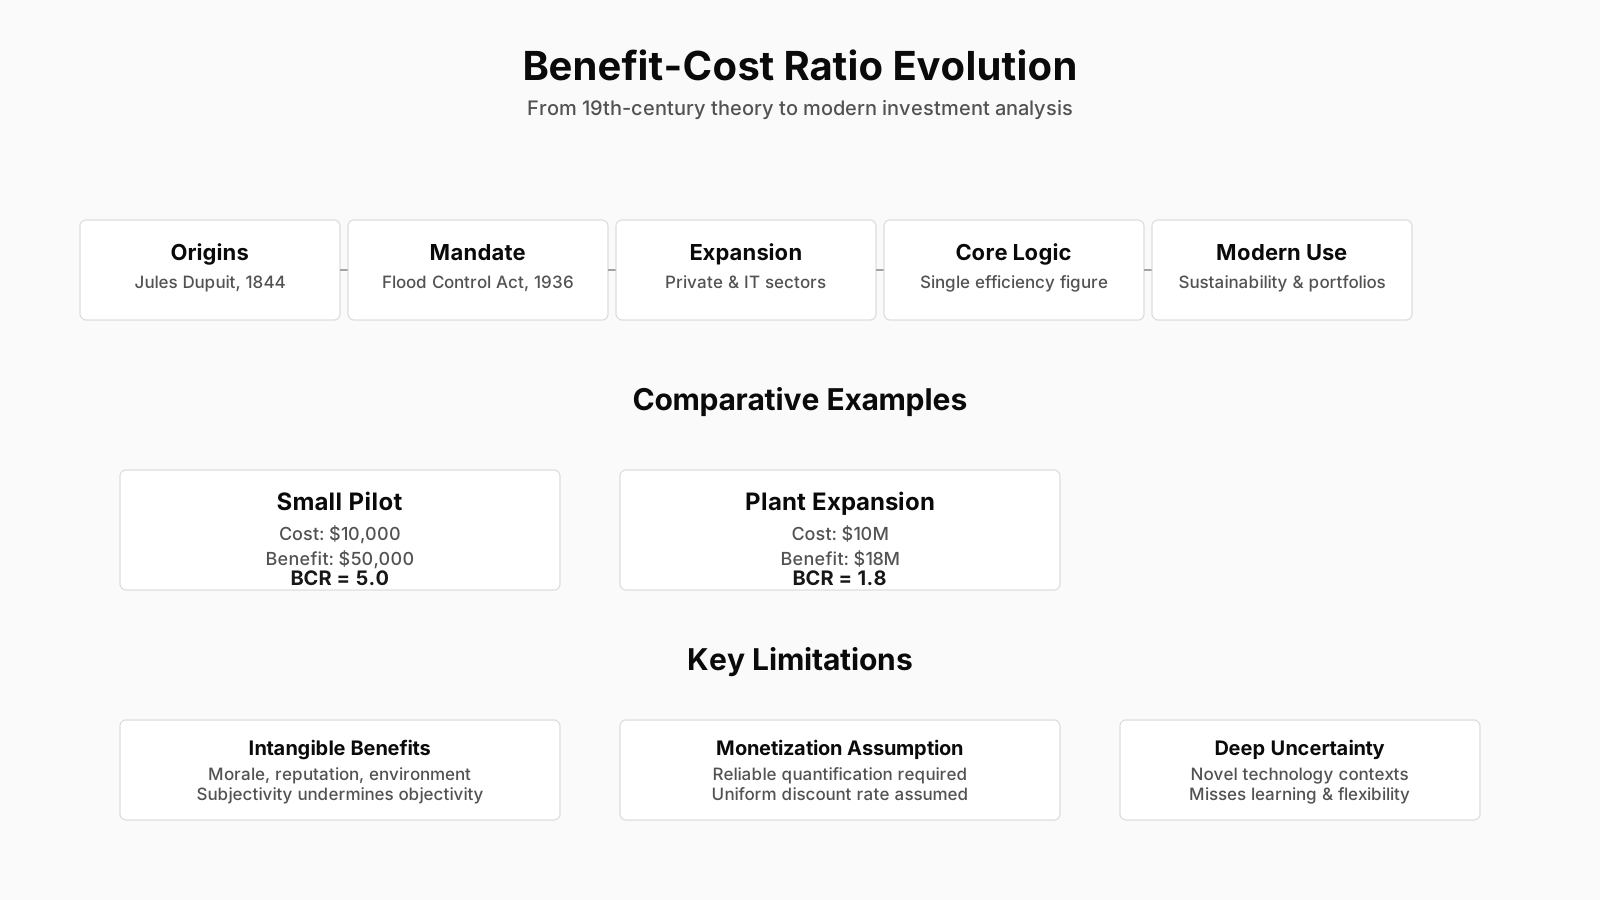
Among the common misconceptions about Benefit-Cost Ratio is the belief that a ratio above 1.0 automatically justifies project approval. In practice, many organizations set a minimum acceptable ratio, such as 1.5 or 2.0, to account for estimation risk and to create a buffer against optimism bias. A project with a BCR of 1.05 is essentially a coin toss once estimation error is considered. Additionally, some stakeholders interpret the ratio as a measure of profitability, which it is not. The BCR shows proportional return efficiency, but a project with a very high ratio and very low absolute benefit may generate less real value to the organization than a project with a lower ratio but larger net value. A small training program with a BCR of 5.0 might deliver $50,000 in benefit against $10,000 cost, while a product launch with a BCR of 1.8 might deliver $18 million. Discarding the latter in favor of the former based purely on ratio would be misguided.
Another pitfall is the selective inclusion or exclusion of benefits and costs to make the ratio look more appealing. Because intangible benefits like “improved customer satisfaction” or “employee morale” are hard to monetize, they are frequently either ignored or inflated. Practitioners often observe that without clear organizational standards, the BCR becomes a political instrument rather than an analytical tool. The solution is not to abandon the ratio but to demand a transparent register of assumptions and, where possible, to model ranges. A BCR of 1.8 with a sensitivity range of 1.3 to 2.4 communicates far more than a single point estimate.
Discount rate selection is another area of persistent difficulty. In decentralized organizations, different business units may use different hurdle rates, making project comparisons invalid. Even within a single analysis, the temptation to lower the discount rate to push a favored project over the threshold is real. Some practitioners mistakenly apply the same discount rate to costs and benefits, when in theory the rate reflects the riskiness of the cash flows, which could differ. In project management, however, a unified rate is standard for simplicity. Understanding these limitations keeps the ratio from being mistaken for an oracle.
Relationship to Other Financial Metrics
The Benefit-Cost Ratio does not exist in isolation. Benefit-Cost Ratio vs net present value comparisons reveal that the two metrics answer different questions. Net present value (NPV) measures the absolute dollar value added to the organization after all costs are subtracted from benefits, both discounted. A project can have a very high NPV and a modest BCR if both costs and benefits are large. BCR answers “how efficient is this investment?”, while NPV answers “how much wealth will this create?”. Sophisticated capital budgeting processes use both together, along with internal rate of return (IRR) and payback period, to form a multidimensional view. A project with an adequate BCR, strong NPV, and short payback period represents a robust profile.
Return on investment (ROI) is another commonly confused metric. ROI is typically calculated as a percentage: net benefit divided by cost, expressed as a rate. BCR is a ratio of total benefit to cost, also a ratio but not technically a rate. For example, a BCR of 1.5 corresponds to an ROI of 50 percent. The two metrics are arithmetically convertible, but BCR is more intuitive for scaling comparisons because it avoids the percentage framing. A project with a 200 percent ROI can sound dramatically more appealing than a 60 percent ROI, but those are simply BCRs of 3.0 and 1.6 respectively. Context determines which presentation lands better with decision-makers.
The payback period, which measures how long it takes for cumulative net benefits to recoup the initial investment, complements the BCR by introducing a time dimension. A project might have a strong BCR but a very long payback period if most benefits materialize in year four or five. Organizations with cash flow constraints may prioritize a lower-BCR project with a rapid payback over a higher-BCR project that ties up capital for years. The interplay among these metrics reinforces that no single number should drive project selection in isolation.
Core Insights on Metric Comparisons
- NPV measures absolute value
- Net present value measures the dollar gain by subtracting discounted costs from discounted benefits, meaning a project can deliver a high NPV alongside a modest benefit-cost ratio when both its costs and benefits are substantial.
- BCR and ROI are directly convertible
- Return on investment is the benefit-cost ratio minus one, expressed as a percentage, so a 200 percent ROI equals a BCR of 3.0 and a 60 percent ROI equals a BCR of 1.6; BCR avoids the perceptual distortion introduced by percentage scaling.
- Payback period adds a time dimension
- The payback period complements the BCR by revealing how quickly cumulative benefits recover the initial investment, leading cash-constrained organizations to often prefer a lower-BCR project with fast payback over a higher-BCR project that requires years of capital commitment.
Evolution and Current Thinking
The evolution of the Benefit-Cost Ratio in project management has moved from a purely predictive, upfront calculation toward a more dynamic and iterative application. Traditional project management training long presented the BCR as something you calculate once during the feasibility study, lock into the project charter, and never revisit. Contemporary thinking, heavily influenced by Agile principles and the realization that business environments are volatile, emphasizes continuous value validation. The ratio is now seen as a management dial rather than a historical record. In programs where benefit realization is tracked through post-implementation reviews, BCR provides the link between original justification and actual outcome, closing the learning loop for future estimations.
Debates in the profession center on the monetization of environmental, social, and governance (ESG) factors. As organizations embrace sustainability mandates, pressure mounts to include carbon reduction, community impact, and diversity outcomes in the BCR numerator. Some argue that forcing these elements into a financial metric degrades them to crude approximations. Others counter that omitting them means financial models systematically undervalue projects that deliver long-term, non-shareholder returns. The emerging practice is to maintain a dual presentation: a traditional financial BCR for capital committee review, supplemented by an expanded value ratio that incorporates scored non-financial contributions. This hybrid approach respects the discipline of the original tool while acknowledging its limitations.
Current best practice also stresses the importance of stochastic BCR modeling over deterministic point estimates. Monte Carlo simulation, where thousands of scenarios run varying cost and benefit inputs within plausible ranges, produces a distribution of possible BCR outcomes. A project with a median BCR of 1.8 but a lower fifth percentile of 0.9 presents a fundamentally different risk profile from one with a tight distribution around 1.8. Forward-looking PMOs are building these capabilities into standard templates, demystifying the ratio and making it more robust against the inevitable surprises of project execution.
