In project management, correlation versus causation is the discipline of separating an observed statistical association between two project variables from a demonstrated cause-and-effect relationship that can justify a management intervention. A project manager may see that teams with longer daily standups also report higher sprint velocity, but that observation alone does not establish that longer standups produce higher velocity. The distinction matters because project decisions based on misread relationships can create waste, damage morale, or divert resources from the actual drivers of delivery performance.
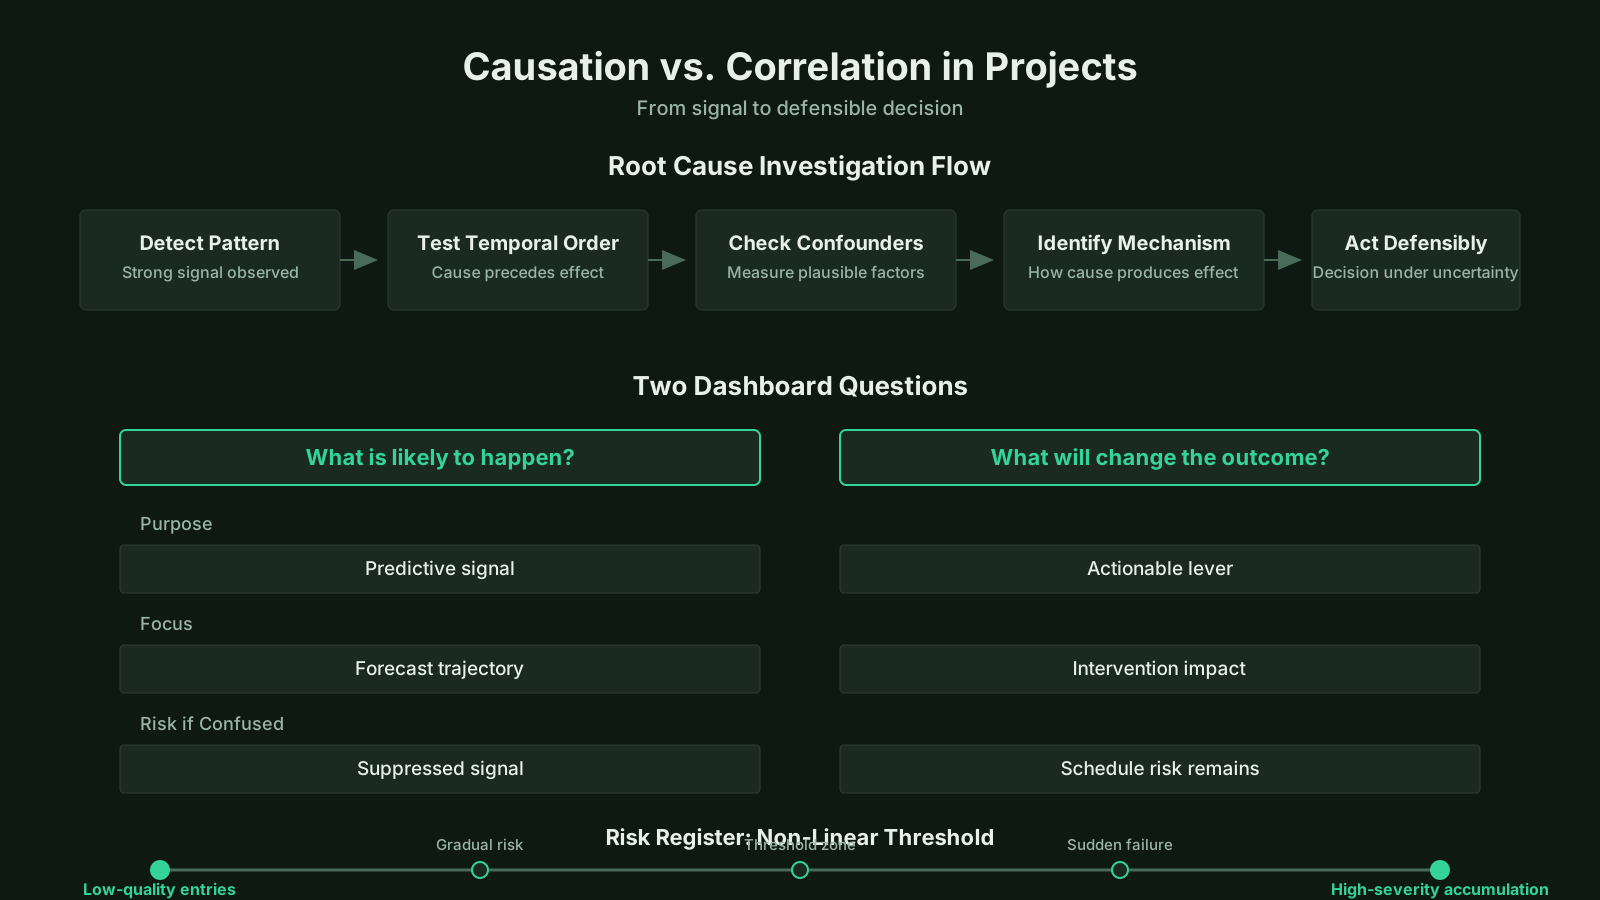
Correlation vs. Causation: Key Topics Overview
| Distinction | Definition |
|---|---|
| Core Distinction | In project management, correlation indicates a statistical association between two variables, while causation requires a demonstrated mechanism and evidence that changing one variable produces a measurable change in the other. |
| Decision Impact | Misinterpreting correlational patterns as causal can misallocate budgets, erode team morale, and trigger ineffective interventions, making this distinction central to defensible project decisions. |
| Quantitative Measurement | Pearson correlation is the default metric for linear association, but Spearman or Kendall rank coefficients are more appropriate when project data are nonnormal, ordinal, or contain outliers. |
| Causal Evidence Criteria | Robust causal claims require a strong and directional association, the cause preceding the effect in time, and the absence of plausible confounding variables. |
| Effect Size vs Operational Relevance | A statistically weak correlation can still warrant action when the outcome is high severity, whereas a strong correlation may be operationally negligible if the variables do not influence key objectives. |
| Temporal Precedence | When a mitigation action is implemented before delivery stability improves, temporal ordering supports a causal interpretation, for example reducing work in process volume shortening cycle time. |
| Cumulative Impact | Persistent low magnitude correlations, such as supplier lead time variability contributing to repeated milestone slippage, become material because their aggregated effect across delivery cycles is substantial. |
| PRINCE2 Governance Alignment | PRINCE2's continued business justification principle demands that claimed benefits be demonstrably produced by the investment, not merely coincident with favorable external market conditions. |
What Is Correlation Versus Causation in Project Management?
At its core, the question what is correlation versus causation in project management refers to the difference between two variables moving together and one variable actually changing the other. A correlation versus causation definition separates a measurable association from a confirmed influence. In formal terms, correlation describes the strength and direction of a relationship, often represented by a coefficient between negative one and positive one. Causation means that a change in one variable produces a change in another, holding other relevant conditions constant.
The Formal Definition of Correlation Versus Causation
Within the language of statistics, correlation refers to a pattern of co-variation. If project duration and defect count rise together across several phases, the two variables are positively correlated. If team autonomy rises while voluntary turnover falls, the association is negative. The most common measure is the Pearson correlation coefficient, although project data often violates its assumptions and practitioners may use rank-based alternatives. Causation, by contrast, requires evidence that an intervention or change in one factor produces the observed change in the outcome, not merely that both changed in the same period.
Project management borrows this distinction from philosophy and applied statistics. The classical fallacy of post hoc ergo propter hoc assumes that because an event followed another, the first caused the second. The related cum hoc fallacy assumes that because two events occur together, one causes the other. In project work, both fallacies appear when managers treat metrics that share a timeline as evidence of a causal chain.
Why the Distinction Matters in Project Work
Project environments are noisy, constrained, and rarely allow controlled experiments. A correlation can emerge from a hidden third variable. For example, an infrastructure project may show that delays correlate with frequent scope changes. That relationship is real, but the causal driver might be weak initial requirements, not the change requests themselves. If the project board reacts by limiting all change requests without improving requirements quality, the delay may persist or worsen. The distinction therefore shapes whether a response targets the true mechanism or a visible symptom.
Imagine a scatter plot of overtime hours against rework rates. The points slope upward. A team lead might conclude that overtime causes rework, because tired developers make more errors. But the reverse could also be true: rework demands overtime. Or a third factor, like an unstable scope, could push both upward. The graph shows a relationship, not the direction of influence.
Core Distinction Between Correlation and Causation
- Measurable association versus confirmed influence
- Correlation indicates that two variables move together in a measurable pattern, whereas causation requires evidence that an intervention in one variable directly changes the other.
- Correlation describes co-variation patterns
- In project metrics, a simultaneous rise in duration and defect count across phases reflects a positive correlation, but this co-variation alone cannot establish that one factor drives the other.
- Pearson coefficient and alternatives
- The Pearson correlation coefficient quantifies both the strength and the direction of a linear relationship, yet project data with skew, outliers, or ordinal scales often calls for rank-based measures such as Spearman's rho.
- Causation requires controlled evidence
- Establishing causation requires demonstrating that a controlled change in one factor produces the expected outcome while other plausible influences are held constant, rather than merely showing that two variables changed in parallel.
- Post hoc fallacy in project work
- Project managers often mistake chronological order for causal evidence by assuming that a later event was caused by an earlier one, a logical leap that obscures the real chain of influences behind project outcomes.
Key Components of Correlation Versus Causation
Understanding the key components of correlation and causation requires separating the statistical features of an association from the logical requirements of a causal claim. The key components of correlation and causation include association strength and direction, temporal precedence, and the absence of plausible confounding. Each element plays a different role in project monitoring and risk analysis.
Association Strength and Direction
Strength indicates how closely two variables move together. A strong correlation between schedule pressure and defect density does not make the relationship causal, but it makes further investigation worthwhile. Direction indicates whether both variables move the same way or in opposite directions. Project dashboards often display these relationships implicitly through trend lines. A weak correlation may still be causally important if the outcome is severe, while a strong correlation may be operationally irrelevant if the variables have little impact on objectives.
Project managers should not equate the magnitude of a correlation coefficient with practical significance. A correlation of 0.8 between meeting length and attendance may be statistically strong but commercially meaningless. Conversely, a small but persistent correlation between supplier lead time variance and milestone slippage may matter because the cumulative impact is material. Correlation alone does not provide that judgment.
Temporal Precedence and Plausible Mechanism
Temporal precedence means the cause must occur before the effect. In project data, this is often inferred from sequence rather than demonstrated experimentally. If a risk mitigation action is implemented in phase two and delivery stability improves in phase three, temporal order supports a causal interpretation. But temporal order is not enough. The improvement might have occurred anyway due to team learning, market conditions, or other changes.
A plausible mechanism explains how the cause could produce the effect. For example, reducing work in process may shorten cycle time because fewer concurrent tasks reduce context switching. That mechanism is well established in flow-based delivery. Without a plausible mechanism, a correlation may be spurious. This is why causal analysis in project management routinely combines data patterns with process knowledge and team expertise.
Confounding, Spurious Correlation, and Reverse Causation
Confounding occurs when an unmeasured variable influences both the suspected cause and the observed outcome. A program may find that projects with more governance meetings have lower cost overruns, but project complexity could be the confounder. Simpler projects may need fewer meetings and naturally experience less cost pressure. Without controlling for complexity, the governance meetings appear protective even if they are not the driver.
Spurious correlation is an association that arises from chance or from a common external factor rather than any meaningful connection. With enough project metrics, some will correlate by chance. Reverse causation occurs when the assumed direction of influence is wrong. For instance, low team morale may correlate with high defect rates. It is tempting to say defects damage morale, but poor morale can also reduce attention and create defects. Disentangling these possibilities usually requires longitudinal data and careful causal analysis.
Correlation Versus Causation in PMBOK and PRINCE2
Project management frameworks rarely use the phrase correlation versus causation as a named artifact, but the underlying logic appears throughout planning, monitoring, and controlling processes. Correlation versus causation in PMBOK emerges most clearly in data analysis techniques, risk identification, quality management, and performance reporting. PRINCE2 embeds the same reasoning in its risk and lessons practices, although it also does not present the distinction as a separate management product.
Correlation Versus Causation in PMBOK Data Analysis
The PMBOK Guide positions data analysis as a core technique across several knowledge areas. In Monitor and Control Project Work, variance analysis compares actual performance to the performance measurement baseline. A variance may correlate with a specific phase or workstream, but PMBOK does not instruct the project manager to treat the first visible correlation as a confirmed cause. The process expects further analysis. In Perform Quality Control, control charts and scatter diagrams reveal patterns. A control chart can show a run of points on one side of the mean, but determining why requires root cause analysis, not just visual association.
Within Project Risk Management, risk identification distinguishes causes, risk events, and impacts. A risk register documents this structure to avoid confusing a correlated condition with a causal trigger. For example, poor communication may correlate with stakeholder dissatisfaction, but the risk event may be a specific decision made without stakeholder input. The risk response then targets the causal event, not the correlated condition. This structural separation is central to effective risk responses.
PRINCE2 Lessons and Risk Registers
PRINCE2 emphasizes learning from experience as one of its principles. The lessons log and lessons report record what happened and what worked, but the method expects a reasoned evaluation of why something worked. A project may report that daily risk reviews correlated with fewer missed issues. PRINCE2 does not require that the next project adopt daily risk reviews automatically. Instead, the project management team should consider whether the practice caused the improvement or whether the team's experience, the project's complexity, or other factors explain the result.
The PRINCE2 risk register separates risk cause, risk event, and risk effect. This structure is a causal model in miniature. If the cause is poorly specified, the response may be aimed at a correlated symptom. PRINCE2's continued business justification principle also forces a causal mindset: a project should only continue if the expected benefits remain linked to the investment and not merely correlated with unrelated market trends.
Key Insights on Causal Reasoning
- PMBOK variance analysis limits
- The PMBOK variance analysis used in Monitor and Control Project Work compares actual performance to the baseline, yet it deliberately avoids instructing project managers to treat the first observed correlation as a verified causal relationship.
- Root cause analysis required
- Control charts and scatter diagrams in Perform Quality Control can expose patterns such as runs above the mean, yet the reasons behind these patterns become clear only through structured root cause analysis rather than through visual association alone.
- PRINCE2 causal justification principle
- PRINCE2 integrates the same correlation versus causation reasoning into its risk and lessons practices, and its continued business justification principle ensures benefits remain causally connected to the investment instead of merely tracking unrelated market trends.
Correlation Versus Causation in Agile, Hybrid, and Value-Oriented Frameworks
Agile and hybrid environments produce abundant metrics, and the volume of data increases the risk of false causal conclusions. Correlation versus causation in Agile settings commonly appears when teams interpret velocity, cycle time, throughput, and customer satisfaction as levers rather than signals. Empirical process control encourages inspection and adaptation, but the data still requires interpretation. Hybrid programs combine predictive baselines with iterative delivery, creating mixed data sets where correlations can easily cross levels of analysis.
Correlation Versus Causation in Agile Metrics
Velocity is one of the most widely used Agile metrics. It measures the amount of work a team completes in a sprint. A rising velocity may correlate with improved team capability, but it may also reflect story point inflation, smaller stories, or a change in definition of done. Treating velocity as a cause of better outcomes can lead teams to optimize the number while undermining value delivery. Similarly, shorter cycle time may correlate with higher customer satisfaction, but a hidden variable such as clearer requirements could be driving both. Agile teams therefore use retrospectives and root cause analysis to move from observed patterns to actionable understanding.
Cumulative flow diagrams illustrate work in process across stages. A stable system often shows a predictable relationship between work in process and cycle time. Under defined conditions, this relationship is causal because excessive work in process creates queueing delays. Agile practitioners can use flow metrics to identify real constraints, but they must still verify the mechanism in their specific context. The presence of a pattern is not proof that the same mechanism operates in every team.
Hybrid Environments and Cross-Team Data
Hybrid programs face a special challenge. Some teams report velocity, others report earned value, and still others report milestone completion. Aggregating these measures into a single dashboard creates correlations that may not exist at the team level. A hybrid program manager might see that teams using a particular tool report fewer delays. That correlation could arise because mature teams are more likely to adopt the tool, not because the tool causes delivery speed. Cross-team comparisons are especially vulnerable to confounding because team context, product type, and stakeholder environment all differ.
BVOP Business Value Points and Process Damage
Business Value-Oriented Project Management treats a persistent decline in Business Value Points as a signal for deeper inspection rather than automatic proof of a single cause. Its concept of process damage describes invisible organizational harm that accumulates through overwork, perfectionism, or rejected acceptable work. Because such harms often correlate with visible delivery patterns, BVOP requires causal analysis before corrective action is selected.
Purpose and Importance of Distinguishing Correlation from Causation
The importance of distinguishing correlation from causation influences almost every control decision in a project. The importance of distinguishing correlation from causation is highest when the cost of a wrong intervention is large. If a program responds to a correlated pattern by imposing a new process, shifting staff, or changing a supplier, the consequences ripple across teams and budgets. The distinction protects project governance from acting on noise.
Decision Quality Under Uncertainty
Project managers operate under uncertainty and incomplete information. A correlation provides a useful clue but not a decision rule. When a portfolio steering committee sees that projects with dedicated product owners report higher benefits realization, the natural question is whether dedicated product owners cause better outcomes or whether better business cases attract dedicated product owners. Answering that question changes the investment decision. If the relationship is causal, funding the role may make sense. If it is confounded by business case quality, the intervention should focus on earlier stages.
Ignoring the distinction can lead to superficial metrics governance. Teams may be rewarded for activities that correlate with success without evidence that they drive success. This is a known problem in performance measurement systems. The result is often gaming, where people optimize the correlated activity while the underlying outcome does not improve.
Avoiding Harmful Interventions
Misreading correlation as causation can generate real harm. A common scenario occurs with overtime. A project may observe that months with more overtime have higher output. Leadership then mandates overtime as a standing practice. Over time, output may decline due to fatigue, attrition, and quality problems. The initial correlation was real, but the causal model was incomplete. More overtime and higher output were both driven by a push to meet a milestone. The proper causal question was whether the milestone pressure, not the overtime, produced the temporary gain.
Another harmful intervention occurs when teams are ordered to replicate practices from high-performing projects without understanding context. A retrospective may show that high-performing teams hold more informal design sessions. The correlation is visible. Mandating informal sessions across all teams may fail because the original teams had psychological safety and technical expertise that supported those sessions. The practice was not the sole cause of performance.
Key Insights on Correlation vs. Causation
- High stakes amplify wrong interventions
- The need to separate correlation from causation becomes critical when a failed intervention would be costly, because misapplied changes such as new processes or staffing adjustments can cascade across teams and budgets.
- Correlation offers clues, not decision rules
- Project managers operating under uncertainty and incomplete information should treat correlations as exploratory signals that warrant further investigation, not as prescriptive rules that dictate immediate action.
- Confounders hide the true cause
- When a portfolio committee observes that projects with dedicated product owners report higher benefits realization, it should examine whether product owners drive better outcomes or whether stronger business cases attract product owners, since that confounder shifts the effective intervention point to an earlier project phase.
- Blind replication triggers gaming behavior
- Mandating that teams copy practices from high-performing projects without understanding why those practices work often triggers gaming behavior, in which people optimize the correlated activity while the underlying outcome remains unchanged.
Common Misconceptions About Correlation Versus Causation
Several common misconceptions about correlation and causation persist even among experienced project professionals. Common misconceptions about correlation and causation often arise when dashboards display many simultaneous trends and when teams rely on post hoc storytelling. These misconceptions include treating a correlation coefficient as proof, assuming the direction of causality, and underestimating the role of chance.
Misreading Dashboards and Retrospectives
A dashboard may show that projects with frequent status meetings have fewer escalations. A team may conclude that status meetings prevent escalations. But the relationship could operate in reverse: projects with fewer escalations have more time for status meetings, or senior stakeholders demand fewer meetings when a project is already stable. Retrospectives can reinforce this bias because teams naturally search for explanations after the fact. They see a pattern and construct a story that fits their experience. Without a deliberate causal check, the story hardens into a belief.
Another source of error is the use of lagging indicators. Customer satisfaction may rise after a communication plan is introduced. The communication plan may have caused the improvement, or the improvement may reflect a recovering relationship that caused leadership to invest in communication. Project teams often select the more flattering interpretation, especially when defending their own work.
Small Samples and Regression to the Mean
Project data is often sparse. A project may have only eight sprints or ten monthly reports. In small samples, correlations fluctuate widely. A strong pattern in eight data points can disappear entirely with more data. Project managers frequently underestimate this variability. Regression to the mean also creates illusions. If a project had an unusually poor month, the next month is likely to be better regardless of any intervention. A team may credit a new process for the recovery, when the recovery was statistically expected.
The availability heuristic compounds the problem. A dramatic success following a specific practice is more memorable than the many quiet cases where the practice produced nothing. This selective memory creates a false sense of causality. Formal analysis with baseline data and control comparisons can reduce this bias, but the project environment rarely offers a true control group.
Correlation Versus Causation vs Root Cause Analysis
Comparing correlation versus causation and root cause analysis clarifies why the two disciplines are complementary rather than interchangeable. Correlation versus causation and root cause analysis both serve project learning, but they operate at different levels. Correlation analysis identifies patterns worth investigating. Root cause analysis attempts to establish the specific causal path that produced a defect, delay, or risk event.
Different Analytical Goals
Root cause analysis assumes that a problem has identifiable causes. Techniques such as the Ishikawa diagram, the five whys, and fault tree analysis organize potential causes into categories and test their logic. Correlation analysis has no such built-in causal structure. It simply measures co-variation. A project manager might use a scatter diagram to see whether schedule pressure and defect density are associated. If the pattern is strong, the next step is a root cause investigation to determine whether schedule pressure, component complexity, or another factor explains the defects. The two methods answer different questions.
In quality management, Pareto analysis shows that a small number of cause categories account for most defects. The Pareto chart is a frequency analysis, not a causal proof. It says where to look, not what caused the problem. A project team still needs process analysis to confirm that incorrect training, poor specifications, or tool limitations generated the defects. Treating Pareto categories as proven causes is a common shortcut that can misdirect corrective action.
Integrating Correlation Analysis with Causal Methods
In practice, mature project teams combine correlation analysis with process knowledge, controlled experiments where possible, and structured causal reasoning. A project may notice that defects decrease when testing starts earlier. The correlation is clear. Before standardizing early testing, the team examines the mechanism: early testing may reveal integration issues sooner, reduce rework, and improve design feedback. That mechanism is plausible and supported by software engineering practice. The team may then pilot early testing on one workstream and compare outcomes. The pilot provides stronger causal evidence than the original correlation.
This integration also appears in benefits management. A program may report that stakeholder engagement activities correlate with faster permitting. The program manager must determine whether engagement caused faster approvals or whether both were influenced by a politically receptive environment. A causal analysis might compare similar projects with and without engagement, or track the sequence of approval decisions. Such analysis is imperfect, but it improves the credibility of benefits claims.
Key Insights on Correlation and Root Cause
- Complementary analytical approaches
- Correlation analysis reveals statistical patterns and potential associations within project data, while root cause analysis isolates the precise causal chain that explains a defect, schedule delay, or emerging risk.
- Correlation patterns need causal confirmation
- When a correlation pattern appears strong, it should trigger a structured root cause investigation using methods like Ishikawa diagrams, five whys, or fault tree analysis to determine which factor genuinely explains the observed defects.
- Integrating correlation with causal methods
- Mature project teams integrate correlation analysis with domain expertise, controlled testing where feasible, and structured causal reasoning to validate improvement hypotheses before embedding them into standard practice.
Evolution and Current Thinking on Correlation and Causation in Project Management
The evolution of correlation and causation thinking in project management reflects a broader shift from deterministic formulas to probabilistic reasoning. The evolution of correlation and causation thinking has been shaped by quality management, systems thinking, and the growing availability of project analytics. Early project control often assumed that a single metric could be controlled by adjusting a single input. Modern practice recognizes that many project variables are interconnected and that observational data rarely supports simple causal claims.
From Deterministic Control to Probabilistic Interpretation
Early cost and schedule control methods relied on variances and indices. A cost performance index below one meant cost performance was poor, and the project manager was expected to act. The causal path was often assumed to be straightforward: reduce costs, improve processes, or renegotiate contracts. Over time, practitioners recognized that a low index could have multiple causes, including unrealistic baselines, scope changes, resource constraints, or measurement errors. The index itself was a signal, not a diagnosis. This recognition brought causal reasoning into project control.
Systems thinking reinforced the lesson. A delay in one workstream may correlate with low productivity in another, but both may be symptoms of a deeper constraint. Goldratt's theory of constraints, for example, focuses on identifying the binding constraint rather than optimizing every correlated metric. That framework is explicitly causal. It says that improving a non-constraint may not improve the system, even if that non-constraint correlates with some local output. This is a direct application of the correlation versus causation principle.
Current Debates and Statistical Literacy
The rise of project analytics and artificial intelligence has made the distinction more urgent. Machine learning models can find patterns in historical project data, but many of those patterns are correlations. Predictive models of schedule risk may produce accurate forecasts without exposing the causal structure. That is acceptable for forecasting in stable conditions, but it becomes dangerous when leaders use the model to choose interventions. A model may predict that projects using a certain contract type have higher delays. Changing the contract type based on that prediction requires causal confidence, not just predictive accuracy.
There is also a growing emphasis on statistical literacy for project professionals. The ability to question whether a dashboard relationship is causal or merely correlational is now seen as part of project governance. Standards bodies and professional associations increasingly expect project managers to understand basic data analysis, including sampling variability, confounding, and causal inference. This shift does not require every project manager to become a statistician. It requires enough fluency to ask the right questions before authorizing a change.
The field still lacks a single standardized method for causal inference in project management. Techniques from epidemiology, econometrics, and program evaluation are sometimes adapted, but their assumptions may not hold in small project samples. As a result, professional judgment and process expertise remain essential. A project manager who knows that a metric is a signal rather than a verdict is better positioned to make defensible decisions under uncertainty.
