Analytical techniques in project management are the systematic processes, methods, and logical models used to examine data, evaluate complex situations, and support decision-making at every stage of the project lifecycle. Rather than a single tool, the term encompasses a wide collection of structured approaches—both qualitative and quantitative—that help project managers and teams understand root causes, forecast outcomes, assess risks, optimize resource allocation, and validate assumptions. Examples range from earned value analysis and sensitivity analysis to SWOT assessments and Monte Carlo simulations, all of which are applied with the intent of replacing guesswork with evidence-based judgment.
The idea of applying structured analysis to projects did not originate within the project management profession itself. Many of the techniques now standard in project work trace their roots to disciplines such as operations research, systems engineering, quality management, and financial analysis. What distinguishes their use in the project context is not the mathematics or the logic alone, but the fact that these techniques are integrated into the governance, planning, monitoring, and closing processes defined by modern frameworks. In practice, an analytical technique is rarely used in isolation; it is typically embedded within a broader process like risk identification, cost estimation, or schedule control, where it acts as an engine that transforms raw information into actionable insight.
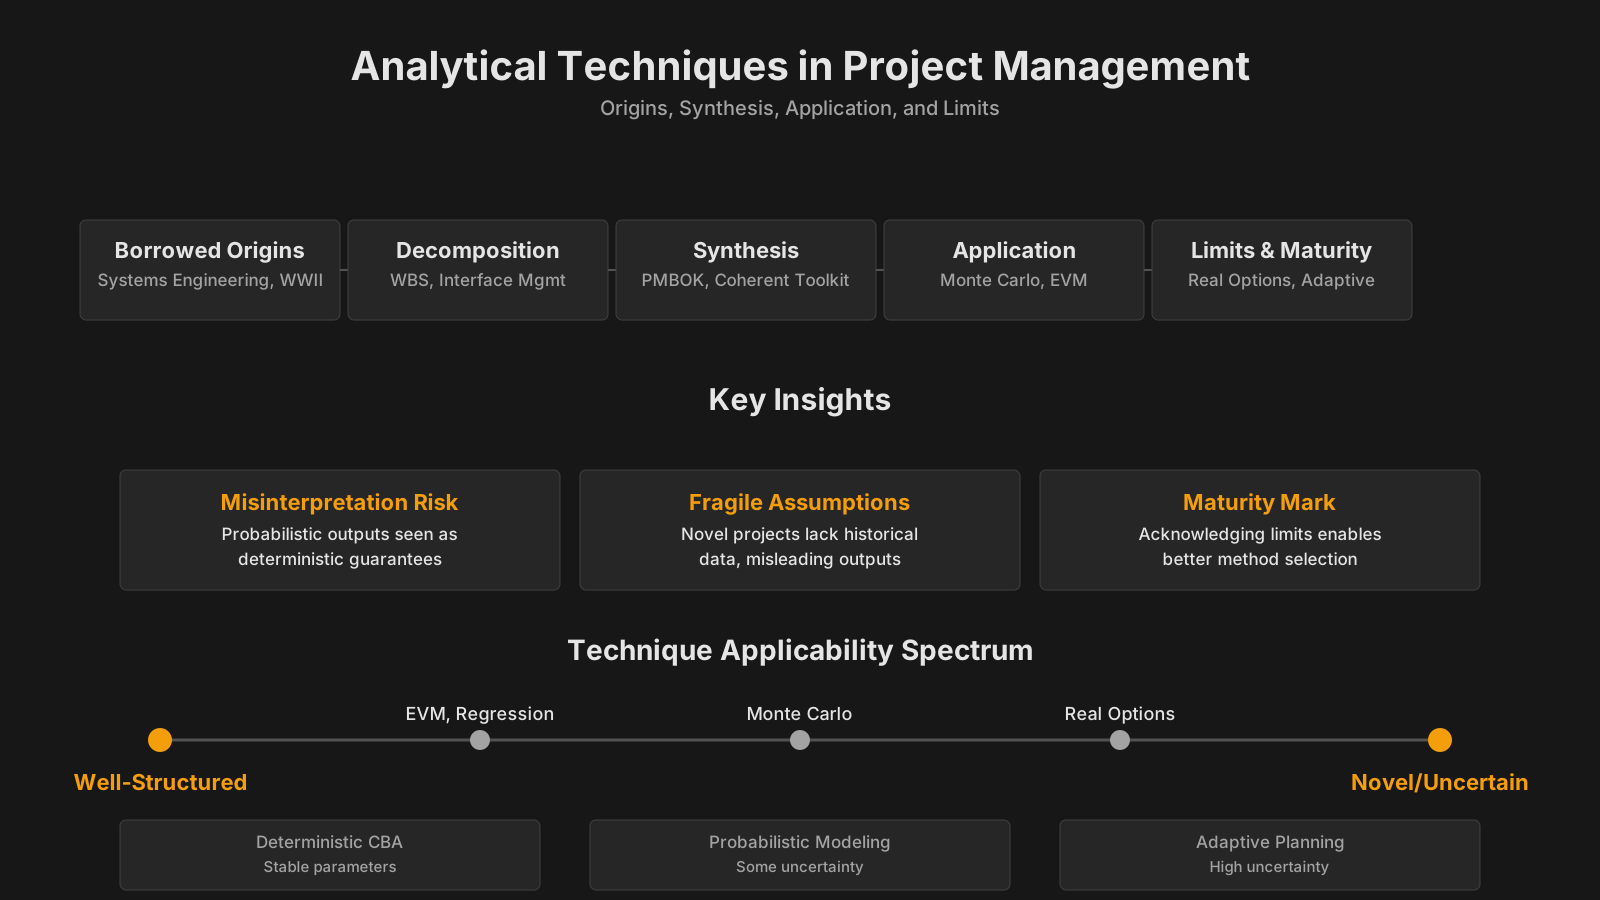
Key Analytical Techniques Summary
| Concept | Summary |
|---|---|
| Analytical Techniques | A comprehensive portfolio of structured qualitative and quantitative methods enabling project teams to diagnose root causes, forecast outcomes, evaluate risks, and optimize resource deployment. |
| Core Purpose | They systematically decompose complex problems or datasets, examine interdependencies, and generate actionable insights that drive project decision-making. |
| Practical Application | Analytical techniques are embedded within core project processes such as risk identification, cost estimation, and schedule control, turning raw data into actionable intelligence rather than operating as standalone exercises. |
| Role in PMBOK | Throughout the PMBOK Guide, analytical techniques are grouped under the Data Analysis tool category and are deployed across virtually all knowledge areas; examples include alternatives analysis, document analysis, trend analysis, and variance analysis. |
| Variance Analysis | Variance analysis goes beyond flagging cost overruns; it isolates the specific work packages, resource allocations, or assumptions that produced the deviation, facilitating precise corrective action. |
| Root Cause Analysis | Root cause analysis originated in quality engineering and is epitomized by Kaoru Ishikawa's fishbone diagram, which continues to serve as a visual cornerstone for structured causal investigation. |
| SWOT Analysis | SWOT analysis traces back to Stanford research in the 1960s and 1970s; it aligns organizational capabilities with environmental conditions, a diagnostic logic that directly supports project context evaluation. |
| Latent Assumptions | Each technique carries latent assumptions about data availability, repeatability, and system stability that often break down in temporary project contexts; for instance, sensitivity analysis typically depends on quantified estimates with wide uncertainty, compromising its reliability. |
What Is an Analytical Technique in Project Management?
The essential nature of an analytical technique definition in project management rests on its function as a formal method for decomposing a problem or data set into its constituent parts, examining relationships among those parts, and drawing conclusions that inform project decisions. Think of it as the intellectual machinery that sits between raw project data—like performance metrics, risk registers, or stakeholder feedback—and the decisions that shape budget allocations, schedule adjustments, or scope changes. In the PMBOK Guide, analytical techniques appear across nearly every knowledge area, often grouped under the broader category of “Data Analysis” tools, and include methods such as alternatives analysis, document analysis, trend analysis, and variance analysis. These are not mere academic exercises; they are the practical means by which a project manager moves from observing a deviation to understanding its cause and choosing a corrective action.
It helps to distinguish analytical techniques from two other categories of project management tools. Data collection techniques—like surveys, interviews, and checklists—gather raw material but do not interpret it. Representation techniques—such as flowcharts, histograms, or control charts—organize and display information visually but do not, by themselves, perform the interpretive work. Analytical techniques occupy the middle ground where judgment meets data. They provide the logic that turns a collection of facts into insight: a variance analysis does not merely show that costs higher than planned; it isolates which work packages, resources, or assumptions drove the overrun. That distinction is crucial because it underscores why analytical techniques are indispensable—they elevate the conversation from reporting to understanding.
Within the project management lexicon, the term “analytical technique” is sometimes used interchangeably with “analysis tool,” but practitioners often reserve the former for the conceptual method itself and the latter for the software or template that executes it. This subtlety matters when aligning techniques with frameworks like PRINCE2 or Agile, which each embed analysis in their own governance structures rather than treating it as a standalone activity. Regardless of the label, the defining feature remains the same: a transparent, repeatable process of reasoning that other team members can scrutinize, challenge, and validate.
Key Insights on Analytical Techniques
- Definition and core purpose
- An analytical technique is a structured, repeatable method that systematically decomposes a problem or dataset into its fundamental components, examines their interdependencies, and produces evidence-based conclusions to guide project decisions.
- Bridge between data and decisions
- Analytical techniques serve as the reasoning engine that converts raw project data, including performance metrics, risk registers, and stakeholder feedback, into informed decisions on budget allocation, schedule compression, and scope control.
- PMBOK data analysis category
- The PMBOK Guide embeds analytical techniques within the Data Analysis grouping across virtually every knowledge area, with alternatives analysis, document analysis, trend analysis, and variance analysis as prominent examples that underscore their universal relevance.
- Interpretive role versus other tools
- While data collection techniques amass raw inputs and representation tools structure them visually, analytical techniques uniquely provide the interpretive logic that transforms isolated facts into coherent, actionable intelligence.
- Technique versus tool distinction
- Professionals typically distinguish an analytical technique, the conceptual reasoning method, from an analysis tool, the software or template that implements that reasoning, yet the essential hallmark of any sound technique is a transparent, repeatable process open to scrutiny and validation by others.
Origins and Cross-Industry Foundations
The intellectual lineage of project management’s analytical techniques origins of analytical techniques in business can be traced through multiple professional traditions that predate modern project management. Decision tree analysis owes much to probability theory and decision science, which gained momentum in the mid-20th century through management consulting and operations research. Monte Carlo simulation emerged from nuclear physics at Los Alamos, and its subsequent adoption in finance and engineering eventually made it a staple for project risk and schedule modeling. Root cause analysis has deep roots in quality engineering, notably within the manufacturing methodologies popularized by figures such as Kaoru Ishikawa, whose fishbone diagram became a visual anchor for causal investigation. SWOT analysis, though often dismissed as simplistic, originated from strategic management research at Stanford in the 1960s and 1970s, where it was used to match organizational capabilities with environmental conditions—a logic that translates directly to project context analysis.
These diverse origins are not merely historical trivia; they explain why analytical techniques in projects often carry hidden assumptions about data availability, repeatability, and stable systems that do not always hold in the messy world of temporary endeavors. A sensitivity analysis appropriated from financial modeling assumes that input variables can be quantified with reasonable confidence, yet a project charter may contain estimates from expert judgment with wide uncertainty bands. Knowing where a technique came from helps the practitioner recognize when its foundational assumptions are strained, and when a different approach, or a hybrid of methods, is called for.
Key Components and Types of Analytical Techniques
Analytical techniques in project management can be understood more clearly when broken into several key components of analytical techniques that define their structure and purpose. The first component is the input—the data, assumptions, or observations that feed the analysis. Input quality dictates output reliability, which is why the “garbage in, garbage out” rule feels especially punishing in projects where estimates are built on incomplete historical data. The second component is the transformation logic—the algorithm, framework, or heuristic that processes inputs into findings. This could be a statistical formula, a set of scoring criteria for alternatives, or a cause-and-effect mapping protocol. The third component is the interpretation layer, where the raw result is contextualized within the project’s objectives, constraints, and stakeholder expectations. An earned value calculation showing a cost performance index of 0.85 is not inherently “bad”; it becomes actionable only when interpreted against the project’s risk appetite, contractual obligations, and recovery options. Finally, the output feeds into a decision or a monitoring signal. These four components—input, logic, interpretation, and decision linkage—are present in every analytical technique, whether as formal as a Monte Carlo simulation or as structured as a weighted scoring model for a make-or-buy decision.
Typologically, analytical techniques fall into several families. Diagnostic techniques such as root cause analysis, fault tree analysis, and cause-and-effect diagrams seek to explain why something happened. This cluster is dominant in quality management and issue resolution. Comparative and selection techniques—including multi-criteria decision analysis, cost-benefit analysis, and decision trees—are designed to evaluate options and recommend a course of action. Their value is highest during planning and procurement, where alternatives must be weighed against divergent stakeholder priorities. Forecasting and predictive techniques like trend analysis, regression, and Monte Carlo simulation project future conditions based on historical patterns and assumptions. They are indispensable for schedule and cost management, but carry a caution: projects are unique, and past data may mislead if underlying conditions have changed. Monitoring and control techniques, such as variance analysis, earned value management, and performance index trend tracking, flag deviations from baselines and quantify their magnitude. While they do not diagnose the cause, they trigger the use of diagnostic methods. This layered classification matters because teams that misapply a technique—using a selection tool to diagnose a problem, or a forecasting method to control scope—often generate answers that look rigorous but are irrelevant to the decision at hand.
Key Takeaways on Analytical Frameworks
- Four components underpin every technique
- Every analytical technique, from Monte Carlo simulation to weighted scoring models, is built on four core components: the quality of input data, the logic used to transform it, the interpretation of results, and how outputs connect to the decision at hand.
- Input quality determines output reliability
- No method, no matter how advanced, can rescue flawed inputs: incomplete historical data or weak assumptions strictly limit the reliability of any output, a reality captured by the garbage-in, garbage-out principle.
- Results need contextual interpretation
- A raw metric such as a cost performance index of 0.85 becomes actionable only after it is weighed against the project’s specific objectives, risk appetite, active constraints, and the range of realistic recovery options.
- Technique misapplication creates false confidence
- Comparative and selection tools like cost-benefit analysis and decision trees are built to evaluate options, not to diagnose problems; when misapplied as diagnostic instruments, they generate outputs that appear rigorous but are fundamentally irrelevant.
Analytical Techniques in PMBOK and Other Frameworks
The PMBOK Guide incorporates analytical techniques not as a single knowledge area but as a pervasive toolset embedded in many of its process groups and knowledge areas. In analytical techniques in PMBOK and its mapping, these methods appear under the umbrella term “Data Analysis” in the sixth and seventh editions, covering techniques like alternatives analysis, cost-benefit analysis, trend analysis, variance analysis, and earned value analysis. For instance, the Monitor and Control Project Work process relies on alternatives analysis and cost-benefit analysis to evaluate change requests and determine corrective actions. The Control Schedule process applies trend analysis and performance reviews, while Control Costs leans heavily on earned value and variance analysis. In the risk knowledge area, quantitative risk analysis uses sensitivity analysis, expected monetary value, and simulation techniques to generate probabilistic forecasts of cost and schedule outcomes. The subtle shift in PMBOK 7—toward principles-based guidance—has not reduced the role of analytical techniques; instead, it frames them as part of a broader value delivery system where analysis must be continuously aligned with stakeholder expectations and project tailoring.
PRINCE2 approaches analysis from a governance viewpoint. It does not prescribe specific statistical tools as much as it mandates logical reviews at defined control points. Product-based planning, for example, requires analytical decomposition of the final product into sub-products and activities, supported by product descriptions and flow diagrams. The “Managing Product Delivery” and “Controlling a Stage” processes embed analysis within issue and risk assessments, often using structured models like the change control procedure and quality review techniques. The analytical rigor comes from the framework’s insistence on explicit criteria, tolerance-based exception reporting, and documented lessons—all of which demand systematic analysis rather than ad hoc intuition.
Agile environments treat analytical techniques differently, but no less rigorously. Techniques such as velocity analysis, cumulative flow diagrams, and lead-time analysis serve as the quantitative backbone of iterative delivery. Story point estimation, while often criticized for inconsistency, constitutes a comparative analytical method when combined with historical velocity data to forecast sprint and release capacity. Burndown charts provide trend analysis, exposing whether the team is on track or likely to overshoot the timeframe. The key distinction is that Agile analysis rarely aims for upfront precision; instead, it uses empirical data from completed work to continuously recalibrate plans. In this sense, the analytical techniques adapt to the empirical process control model underlying Scrum, functioning as feedback loops rather than predictive engines.
Practical Application and Use Across the Project Lifecycle
In the daily reality of project work, analytical techniques are not performed in a sterile laboratory; they are woven into meetings, reviews, and decision forums under time pressure and competing agendas. practical application of analytical techniques begins during project initiation, where feasibility analysis, business case reviews, and stakeholder value assessments rely on tools like cost-benefit analysis and SWOT to determine whether the project should move forward. A project manager might facilitate a session where the sponsor’s assumptions are examined through sensitivity analysis, revealing which variables hold the greatest leverage over net present value. That early analytical work shapes the entire trajectory by filtering out non-viable options before resources are committed.
During planning, the density of analytical activity intensifies. Scope definition uses decomposition techniques and product analysis, while scheduling applies critical path analysis, resource smoothing algorithms, and what-if scenario modeling. Risk workshops use probability-impact matrices and expected monetary value calculations to prioritize the risk register. Cost estimating may deploy parametric models or analogous analysis, and procurement decisions hinge on make-or-buy analysis with multi-criteria weighting. The planning phase is where analytical techniques are often most visible, yet their true test comes later when baselines must be defended and adjusted. Monitoring and controlling then shifts the focus to diagnostic and comparative analysis: earned value metrics reveal cost and schedule variances, cause-and-effect diagrams trace performance problems to root causes, and trend charts detect patterns that simple variance flags miss. The human dimension enters strongly here; the same variance number presented to a cost-conscious sponsor versus a quality-obsessed product owner may trigger entirely different analytical follow-ups, because interpretation is always filtered through stakeholder salience.
Closing processes also apply analysis, though in a retrospective mode. Benefits realization reviews compare forecasted outcomes from the business case against actual performance, often using gap analysis and lessons-learned data mining. Post-project root cause analysis of major issues informs organizational process assets, feeding future analytical baselines. In program and portfolio settings, these techniques aggregate to support investment selection, resource balancing, and benefits tracking across multiple initiatives, connecting tactical project analysis to strategic organizational decisions.
Key Insights on Lifecycle Analytics
- Initiation stage screens viability
- Rigorous feasibility studies, structured business case evaluations, and sensitivity analyses at the initiation stage systematically eliminate unsound projects before capital and talent are allocated.
- Planning phase deploys specialized tools
- Detailed work breakdown structures, critical path scheduling, resource leveling, parametric cost estimates, and strategic make-or-buy evaluations equip planning teams with a precise analytical foundation.
- Monitoring shifts to diagnostic analysis
- Earned value management, Ishikawa diagrams, and trend analysis move beyond mere variance detection to uncover cost and schedule anomalies along with their underlying drivers.
- Stakeholder salience shapes follow-up
- Identical variance data provoke distinct analytical paths, shaped by each stakeholder’s primary focus, be it cost containment, quality assurance, or other competing business objectives.
- Portfolio aggregation connects to strategy
- At program and portfolio levels, aggregated analytics feed into capital allocation decisions, resource optimization across projects, and the continuous monitoring of strategic benefits realization.
Common Challenges, Pitfalls, and Misconceptions
One of the most persistent misconceptions is that analytical techniques guarantee objective truth, when in fact every technique is only as sound as its framing assumptions and input data. challenges with analytical techniques in projects often stem not from mathematical errors but from boundary conditions that practitioners ignore. A Monte Carlo simulation that produces a 90-percent confidence schedule may appear authoritative, but if the underlying duration estimates were biased by optimism or political pressure, the output is a precise expression of a flawed premise. This illusion of rigor creates dangerous overconfidence, especially when senior stakeholders interpret statistical outputs as definitive forecasts rather than as conditional scenarios.
A related pitfall is the tendency to overcomplicate problems that require simpler judgment. A project team facing a minor supplier delay does not need a decision tree analysis when a straightforward threshold-based escalation rule would suffice. The counterbalance, however, is that teams sometimes avoid rigorous analysis when faced with intimidating complexity, relying on intuition shaped by past projects that may not resemble the current one. Striking the right balance is a skill that develops with experience and depends heavily on the project’s criticality and risk exposure. Another significant challenge is the availability and integrity of data. Many analytical techniques assume a baseline of historical performance information that simply does not exist for organizations early in their project management maturity journey. In such settings, adopting techniques like parametric estimation without a calibrated database can produce estimates that are worse than guesswork because they carry a false veneer of accuracy.
Misunderstandings also arise around the difference between a technique and its software implementation. Installing a sophisticated project analytics tool does not inherently improve analytical thinking; the tool automates calculations but cannot define the problem, validate assumptions, or choose which variables matter most. Organizations sometimes conflate dashboard visibility with analytical capability, believing that real-time data display equates to insight generation. Analysis is a cognitive process that tools can support but never replace. Finally, cultural and political factors often derail analytical efforts: the project manager who presents a variance analysis that implicates a powerful functional manager’s poor estimates may find the analysis dismissed or discredited not on its merits but because of organizational dynamics. Technical competence must therefore be paired with stakeholder awareness to ensure that sound analysis actually influences decisions.
Relationships to Other Project Management Concepts
Analytical techniques share a symbiotic relationship with decision-making models, data management practices, and governance structures. analytical techniques vs data analysis tools represents a distinction that matters when aligning project processes. Data analysis is the broader activity that includes collection, cleaning, transformation, and modeling; analytical techniques are the specific methods that perform the modeling and interpretation. In the PMBOK environment, analytical techniques are often the “T&T” (tools and techniques) entries within processes, while data gathering and representation methods flank them. When a team conducts a trend analysis, they are applying an analytical technique to a dataset that may have been collected through a data gathering technique like a status report. The relationship thus forms a chain: gather data, apply analytical technique, generate output, feed into a decision process. Confusing any link in this chain—say, treating a representation tool like a flowchart as a stand-in for analysis—can break the logic that connects project information to project action.
Similarly, analytical techniques are closely tied to risk management, quality management, and performance measurement baselines. In risk management, the risk register and risk breakdown structure provide the taxonomy, while sensitivity analysis and Monte Carlo simulation supply the quantitative muscle. Quality management draws on root cause analysis and Pareto analysis to drive continuous improvement out of defect data. Earned value management, as a performance measurement baseline, is itself a composite analytical framework that integrates scope, schedule, and cost variances. The concept of “management by exception,” prominent in PRINCE2, depends on analytical thresholds (tolerance limits) that trigger escalation. When tolerances are breached, the analysis shifts from monitoring to diagnosis, connecting the analytical technique to the governance structure. This interconnectedness means that a weakness in one analytical area can cascade; poor cost variance analysis may mask the early signals of a systemic estimating error that eventually corrupts schedule forecasts and risk reserves.
Key Takeaways on Analytical Connections
- Symbiotic project relationships
- Analytical techniques, decision-making models, data management practices, and governance structures weave together into a mutually reinforcing system where each element amplifies the others, so none can function effectively in isolation.
- Techniques versus data analysis
- Data analysis represents the full lifecycle of collecting, cleaning, transforming, and modeling information, while analytical techniques are the targeted methods that conduct the modeling and interpretation at the heart of that workflow.
- The project information chain
- Project work follows a logical sequence that moves from data gathering through analytical technique application to generating an output that directly feeds a decision process, and mishandling any link severs the crucial connection between raw information and meaningful action.
- Risk management integration
- Within risk management, the risk register and risk breakdown structure provide the foundational taxonomy that sensitivity analysis and Monte Carlo simulation then evaluate quantitatively, converting structured risk information into actionable probability insights.
- Cascading analytical weaknesses
- A single analytical shortcoming can conceal deeper systemic failures, for example when poor cost variance analysis hides a systemic estimating error that silently distorts schedule forecasts and depletes risk reserves.
Evolution, Current Thinking, and Debates
The role of analytical techniques in project management has evolved from a reliance on deterministic spreadsheet models toward more probabilistic, data-driven, and adaptive approaches. evolution of analytical techniques in project management reflects broader shifts in technology and methodology. The rise of project management information systems and business intelligence platforms has made data visualization and real-time trend monitoring more accessible, enabling techniques like predictive analytics where machine learning algorithms flag emerging risks based on patterns in schedule variance, team velocity, and stakeholder communication sentiment. While the PM profession has not yet fully embraced artificial intelligence for decision automation, the conversation is moving toward augmented analysis—where algorithms highlight anomalies and a human analyst interprets them within the project context.
Current debates center on the tension between traditional rigorous quantitative analysis and the lightweight, empirically driven techniques of Agile. Advocates of detailed risk modeling point to the insurance industry and large infrastructure programs where probabilistic cost analysis is a contractual requirement, while Agile practitioners counter that in fast-changing environments the cost of maintaining elaborate analytical models exceeds the value of the precision they offer. Both camps are partly correct; the appropriate choice depends on uncertainty type. For projects where physical laws and stable system behavior apply, heavier quantitative methods work well. For projects where requirements and technologies are emergent, iterative empirical analysis using sprint data is often more responsive.
Another significant shift is the recognition that analytical techniques must be evaluated not solely on technical accuracy but on their influence on human behavior. Behavioral economics has crept into the profession, reminding us that analytical outputs are consumed by people with cognitive biases. A strikingly precise Monte Carlo output can provoke anchoring, making stakeholders reluctant to adjust even when new information arrives. Some modern methodologies, including Business Value-Oriented Project Management, incorporate tailored analytical practices such as Business Value Points for tracking value delivery trends and defect analysis using predefined root-cause categories to reduce subjectivity in quality investigations. These approaches demonstrate an awareness that the social and organizational system surrounding the analysis is as critical as the mathematics. As project management continues to mature, the conversation is less about whether to use analytical techniques—they are indispensable—and more about how to design the analytical ecosystem so that it supports better conversations, reveals rather than conceals uncertainty, and genuinely improves project outcomes rather than simply decorating status reports with elaborate charts.
