Comparing actual cost to planned cost is the core of financial control in any project. At its simplest, it means taking the real money spent on labor, materials, equipment, and other resources and holding it up against what the project plan said you would spend by now. In project management, this act of comparison is not just an accounting exercise; it is a diagnostic signal that reveals whether a project is drifting into unplanned territory, whether the original estimates were too optimistic, or whether scope is accumulating without recognition. The straightforward arithmetic of subtracting actual cost from planned cost, however, can be dangerously misleading if it stands alone. The practice of measuring actual cost against planned cost forms the foundation of cost variance analysis, forecast creation, and the early warning systems that keep projects from quietly slipping into financial distress.
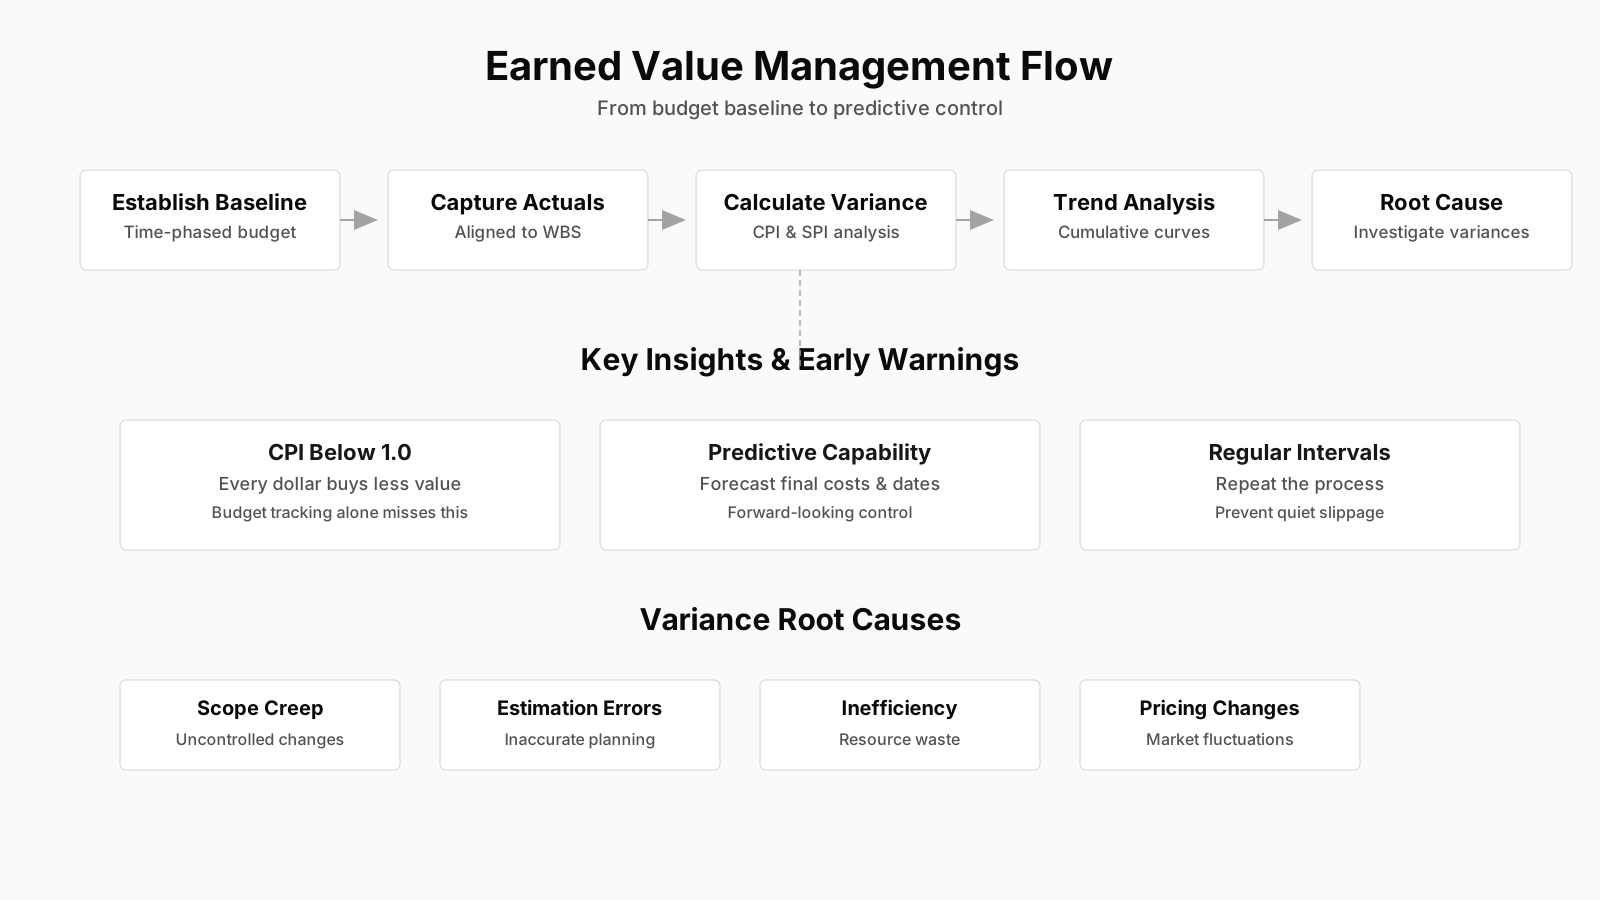
Quick Summary: Actual Cost vs. Planned Cost
| Key Concept | Summary |
|---|---|
| Variance Diagnostic | Comparing actual cost to planned cost exposes unplanned schedule drift, overly optimistic estimating assumptions, and unrecognized scope accumulation, serving as an early diagnostic signal. |
| Cost Input Sources | Actual costs are aggregated from timesheets, supplier invoices, expense reports, and equipment charges; planned costs are drawn from the time-phased cost baseline approved in the project management plan. |
| EVM Fundamentals | Planned Value (PV) is the authorized budget for scheduled work and Actual Cost (AC) the realized expenditure; the relevant spending variance in EVM is Cost Variance (CV) = Earned Value (EV) minus AC, not PV minus AC. |
| Variance Blind Spots | A simple spending variance does not reveal whether scheduled work was actually completed, so that comparison must be paired with scope and schedule performance data to be meaningful. |
| Cost Baseline Profile | The cost baseline is the authorized, time-phased budget excluding management reserves, typically shown as an S-curve that gradually rises over the project’s life cycle. |
| Accrual Accounting Practice | Actual costs should be recorded on an accrual basis, when obligations are incurred rather than when cash is disbursed, to avoid presenting a misleadingly favorable cost position. |
| Variance Analysis Methods | Cost comparisons can be performed cumulatively or period by period, using predefined variance thresholds to escalate persistent drift for root-cause analysis and potential change requests. |
| Governance & Intervention | Routine comparison grants project managers early visibility to reallocate resources, renegotiate vendor contracts, or secure additional funding before overruns escalate beyond control. |
| Forecasting & Escalation Prevention | Actual cost comparison directly informs the Estimate at Completion (EAC) forecast and helps organizations resist the sunk cost fallacy, enabling objective decisions on continued funding. |
| Budget vs Cost vs Value | The budget is total authorized funding; planned cost is its time-phased allocation; earned value measures the budgeted cost of work actually performed, distinguishing it from both other measures. |
What Is Actual Cost Compared to Planned Cost?
The actual cost compared to planned cost definition refers to the deliberate monitoring practice of capturing all real expenditures incurred on project activities and contrasting them with the time-phased budget that was authorized for those same activities. This comparison is not a one-time event; it occurs continuously throughout the project life cycle, typically at predefined reporting intervals. The raw numbers come from two streams. Actual cost (AC) is assembled from timesheets, vendor invoices, expense reports, procurement receipts, and equipment charges. Planned cost, on the other hand, is drawn from the cost baseline, a component of the project management plan that distributes the total approved budget across the project calendar.
In formal earned value management (EVM) terms, planned cost is represented by the Planned Value (PV), the authorized budget assigned to scheduled work. Actual Cost is the realized cost incurred for the work performed. The most basic comparison is the simple difference, sometimes called the spending variance: PV minus AC. A positive number suggests that less money has been spent than planned for that period; a negative number signals an overspend relative to the plan. This raw figure, however, says nothing about whether the work that was supposed to be done actually got done. A team could be spending precisely the budgeted amount but delivering only a fraction of the scope. For that reason, modern project management almost always couches this comparison inside a larger performance measurement framework.
Outside of EVM, the phrase “actual cost compared to planned cost” is used more loosely. A sponsor might ask simply, “How much have we spent against the budget?” In such cases, planned cost means the total budget or the phased spending target, and the comparison yields a rough sense of financial consumption. The discipline of project control, however, insists that meaningful comparison demands scope and schedule data alongside cost figures. Without that, the numbers can generate a false sense of security or trigger unnecessary alarms.
Key Insights on Cost Comparison
- Continuous cost monitoring practice
- Continuous monitoring compares actual expenditures sourced from timesheets, vendor invoices, and expense reports against the approved time-phased budget throughout the project life cycle, delivering a real-time audit of financial performance.
- EVM spending variance calculation
- In earned value management, the spending variance is computed as Planned Value minus Actual Cost; a positive result indicates underspending and a negative result signals overspending relative to the plan.
- Limitations of cost-only comparison
- A cost-only comparison does not reveal whether scheduled work has actually been accomplished, so robust project control demands that scope, schedule, and cost data be evaluated together to avoid false reassurance or unnecessary alarms.
Key Components of a Meaningful Cost Comparison
Understanding the key components of actual cost versus planned cost comparison means breaking the practice into its constituent parts: the cost baseline, the actual cost collection mechanism, the variance calculation, and the threshold framework that triggers decisions. The cost baseline is the project’s authorized, time-phased budget, excluding management reserves. It represents the sum of all cost estimates rolled up through the work breakdown structure and distributed across the schedule. For any given date, the planned cost is the cumulative baseline value up to that point. This curve is often depicted as an S-curve, rising gently during early project phases and steepening during execution.
Actual cost encompasses all expenditures that have been recorded, whether invoices have been paid or only accrued. Good practice insists that costs are captured in the period in which the liability is incurred, not when the cash leaves the bank account, otherwise the comparison will show a misleadingly rosy picture during periods of heavy work where invoices are still in transit. Common components of actual cost include direct labor at billable or loaded rates, subcontractor payments, material costs net of discounts, equipment rental or depreciation charges, travel, and indirect costs allocated per the project’s cost accounting rules.
The comparison itself can be performed cumulatively, period by period, or both. Cumulative comparison reveals total budget consumption to date and is the figure most often reported to steering committees. Period-by-period analysis, sometimes called the current period variance, helps isolate when overspends began and whether trends are accelerating. Organizations often set variance thresholds, such as plus or minus 10 percent of the cumulative planned value, that automatically escalate the issue. A single month’s overspend on a multi-year project might be insignificant noise, but a persistent drift that approaches the threshold demands a root cause analysis and possibly a change request.
The Purpose and Importance of Cost Comparison
The importance of comparing actual cost to planned cost in project management lies in its power to enable proactive financial governance. Without this comparison, the project operates in the dark, and the first sign of trouble may be a catastrophic budget overrun with no time left to correct course. Regular comparison gives the project manager and the sponsor early visibility into whether the team is burning funds faster than anticipated. This visibility in turn triggers corrective actions: reallocating resources, crashing or fast-tracking remaining work, renegotiating vendor contracts, or, when necessary, seeking additional funding through formal change control.
Beyond early warning, the comparison feeds the forecasting engine. Projections of the Estimate at Completion (EAC) depend on historical cost performance, and the most reliable forecasts blend actual cost to date with an updated estimate of the remaining work. If actual cost is consistently higher than planned cost for the work accomplished, the EAC will climb accordingly, alerting stakeholders that the business case may need revisiting. This feedback loop protects the organization from the sunk cost fallacy, the dangerous tendency to keep throwing money at a project simply because a lot has already been spent.
Cost comparison also serves a vital governance function. In PRINCE2 environments, the project board uses cost data at stage boundaries to decide whether to authorize the next stage. A significant deviation between actual and planned cost, even if the work is on schedule, forces a deliberate examination of whether the original estimates were flawed or whether external factors have shifted the cost landscape. That conversation, uncomfortable as it may be, is far healthier than silently draining contingency reserves until nothing is left.
Core Takeaways on Cost Comparison
- Enables proactive financial governance
- Continual comparison of actual spend against the baseline gives project managers and sponsors an early signal that funds are being consumed faster than planned, so they can intervene before a manageable variance escalates into a crisis.
- Triggers timely corrective actions
- Cost variance analysis drives concrete responses such as reassigning resources, accelerating remaining activities, renegotiating supplier agreements, or obtaining additional budget through formal change control while the window for effective intervention remains open.
- Feeds reliable cost forecasts
- Estimate at Completion calculations are directly shaped by actual cost performance, and sustained overspend lifts the EAC, forcing stakeholders to reexamine whether the original business justification still holds.
- Guards against sunk cost fallacy
- The regular feedback that cost comparison provides helps organizations resist the temptation to channel more funds into a failing initiative simply because of prior investment, and this discipline strengthens stage boundary decisions in PRINCE2 environments.
Terminology: Planned Cost, Budget, and Earned Value Clarified
A common source of confusion is the loose interchange of the words “budget,” “planned cost,” and “earned value.” The difference between planned cost and earned value is not just academic; it is the hinge on which real cost control turns. In most organizations, the budget refers to the total funds approved for the project, also known as Budget at Completion (BAC). Planned cost, in a control account context, is the time-phased portion of that budget—essentially the planned value curve. Earned value (EV) is the budget associated with the work that has actually been completed, regardless of when it was scheduled or how much it cost.
Imagine a simple construction project: a team is hired to erect 100 meters of fencing with a total budget of $10,000, spread evenly over four weeks. By the end of week two, the plan calls for 50 meters to be complete, so the planned cost is $5,000. In reality, the team has built only 30 meters and spent $4,000. If you compare actual cost ($4,000) to planned cost ($5,000), you see a $1,000 underrun and might feel satisfied. But the earned value of that 30 meters is just $3,000. The real cost variance, EV minus AC, is negative $1,000—meaning the project is over budget for the work actually delivered. This example shows why the simple juxtaposition of actual cost and planned cost, stripped of earned value, can paint a dangerously incomplete picture. It is a reality many project managers discover the hard way, often during a tense steering committee meeting.
In practice, therefore, when practitioners refer to “actual cost compared to planned cost,” they may mean different things depending on the maturity of their controls. In a basic environment, it might simply be spend against original budget. In an EVM-driven department, it almost always means AC versus PV accompanied by AC versus EV analysis. Clarifying which version is intended before a review meeting can prevent a great deal of misinterpretation.
Actual Cost Compared to Planned Cost in PMBOK and PRINCE2
Within the PMBOK framework, the actual cost compared to planned cost PMBOK activity sits squarely in the Monitoring and Controlling Process Group, inside the Control Costs process. The Cost Management Plan defines the rules of the game: the level of precision, the control thresholds, the organizational procedures links, and the EVM rules if used. The project manager collects actual cost data, updates the project documents, and applies variance analysis to determine the cost variance (CV) and cost performance index (CPI). Those metrics are then compared against the thresholds laid out in the plan. If the CPI dips below a certain trigger, the project manager must analyze the trend, investigate root causes, and produce a work performance report that may recommend change requests, corrective actions, or updates to the cost baseline.
The PMBOK also emphasizes that cost control extends to managing changes to the cost baseline. When actual cost to planned cost comparisons repeatedly show a structural understatement of effort, the proper response is not to hide the gap but to initiate integrated change control. The baseline may need to be re-approved, reflecting a new understanding of the work. Many organizations resist re-baselining for fear of appearing to “move the goalposts,” but operating against a knowingly unrealistic plan only destroys the credibility of all future performance reports.
PRINCE2 approaches the same challenge through the concept of management stages and tolerances. The Project Plan sets the overall budget, but the Stage Plan authorizes a more granular spending envelope for each stage. At stage boundaries and through regular Highlight Reports, the Project Manager compares actual spend to the Stage Plan budget and escalates if the forecast exceeds tolerance. PRINCE2 does not mandate EVM, but it is entirely compatible; many PRINCE2 projects overlay EVM metrics on their stage controls. The essential idea remains the same: actual cost must be continuously referenced against a credible, time-phased plan to enable informed decision-making by the project board.
Key Insights on Cost Monitoring
- PMBOK Control Costs process
- Within PMBOK’s Control Costs process, cost variances and the cost performance index are systematically measured against thresholds documented in the Cost Management Plan, which then trigger corrective actions or formal change requests when tolerances are breached.
- Integrated change control for baselines
- When actual costs persistently exceed planned amounts, PMBOK requires integrated change control to formally re-authorize the cost baseline; operating against an unrealistic plan erodes forecast reliability and undermines the credibility of all subsequent performance reports.
- PRINCE2 stage tolerances
- PRINCE2 continuously compares actual spend against stage plan budgets within predefined tolerances, and escalates deviations to the project board through Highlight Reports at stage boundaries. While Earned Value Management is not mandatory, overlaying EVM on stage controls sharpens the board’s ability to make informed decisions.
Agile Environments and Cost Tracking
In Agile projects, the Agile cost comparison methods differ from the traditional deterministic budget, but the underlying need to compare actual spend to a plan remains. Agile teams are typically funded through a fixed capacity, such as a stable team with a known burn rate. The “planned cost” for an iteration is that burn rate multiplied by the iteration length. Actual cost is the real spend, captured from salaries, tools, and infrastructure. The comparison often appears on a sprint or iteration burn chart that plots the planned remaining effort or cost against actual remaining effort or cost. If the team discovers that the actual cost trajectory is diverging from the planned line, the product owner and stakeholders can adjust scope or renegotiate priorities to protect the team’s sustainable pace and the business case.
At the release or project level, cost comparison becomes a forecast-driven exercise. Agile project managers, or delivery leads, compare the actual cost of delivered increments to the planned business value, using velocity and burn rate to predict the cost to complete a minimal viable product or a full release. The rigidness of a line-by-line budget baseline is replaced by an iterative re-planning cadence. That said, the sponsor still asks the same question: “Are we spending what we said we would spend for the value we are receiving?” Agile simply answers that question in shorter cycles, with less reliance on a single upfront cost baseline that may be obsolete within weeks.
BVOP Perspective on Cost and Waste
Business Value-Oriented Project Management adds a layer of analysis that moves the conversation beyond monetary overspend. The BVOP cost variance insight recognizes that a simple financial variance often masks deeper forms of organizational waste. BVOP categorizes waste as overwork, perfectionism, and the rejection of acceptable deliverables, all of which inflate actual cost without producing proportional value. When a team logs extra hours to polish a feature beyond what stakeholders need, actual cost drifts above the planned cost, yet the numbers alone do not reveal the cause. BVOP’s emphasis on value tracking means that the comparison of actual cost to planned cost is always read alongside Business Value Points, giving context to whether an overspend was a wasteful burn or a deliberate investment in accelerated value delivery.
Key Insights on Value-Based Costing
- BVOP broadens cost analysis beyond monetary metrics
- BVOP reframes cost analysis from simple financial variance to value delivery, exposing the deeper organizational waste that monetary overspend often conceals.
- Three categories of organizational waste
- BVOP classifies organizational waste as overwork, perfectionism, and the refusal to accept deliverables that already meet requirements, each inflating actual cost without generating proportional value.
- Overwork drives up costs without an obvious cause
- Extra hours spent refining features beyond stakeholder needs push actual cost above planned cost, yet financial metrics alone obscure the true reason for the variance.
- Value Points frame cost comparisons with context
- BVOP interprets cost variances together with Business Value Points, thereby distinguishing wasteful overspending from deliberate investment that accelerates value delivery.
- Overspend can signify deliberate investment
- Overspend does not automatically indicate waste; BVOP differentiates between resource consumption that erodes value and strategic spending that speeds its realisation.
Who Uses the Comparison and When
Understanding who uses cost comparison in project lifecycle clarifies why the practice is not merely a project manager’s chore. The project manager is the primary user, running the comparison at least monthly to populate status reports, update forecasts, and prepare for governance meetings. The project sponsor consumes the summary, often in dashboard form, to judge whether the project remains a viable investment. For the sponsor, a persistent actual cost overrun coupled with sunk investment may trigger a hard decision to terminate, redirect, or reset the project’s boundaries.
The Project Management Office (PMO) often aggregates cost comparison data across multiple projects, looking for patterns. If several projects in the portfolio show actual costs creeping ahead of planned costs during the requirements gathering phase, the PMO might identify a systemic estimating bias in that organization. Financial controllers and accountants use the comparison to validate accruals and ensure that capitalizable project costs are properly recorded. Even team leads benefit, because a variance analysis can highlight where a particular work package is chewing through budget at an unsustainable rate, allowing the lead to redistribute work or raise a risk before the entire phase is compromised.
Cost comparison is not a one-time gate. It begins the moment the first dollar is spent and intensifies during execution. During project closure, a final actual-to-planned comparison feeds the lessons learned repository, providing data that future estimators can use to calibrate their assumptions. A post-mortem that ignores the cost variance history is a missed opportunity to improve the organization’s estimating maturity.
Common Misconceptions and Pitfalls
Several common misconceptions about actual cost vs planned cost undermine the effectiveness of project financial control. One of the most persistent is the belief that an underrun is always good news. An underrun can mean the project is ahead of schedule and spending less, but it can just as easily signal that work has stalled, invoices have not been processed, or scope has been silently descoped without formal acknowledgment. In a large infrastructure project, a sudden sharp drop in actual cost against plan might indicate a contractual dispute causing a work stoppage, not a sudden burst of efficiency.
Another pitfall is comparing actual cost to the original budget without adjusting for approved changes. When formal change requests have increased the budget, the baseline must be updated, or the comparison will generate a false variance. Some organizations resist re-baselining because they want to preserve a “before and after” story, but that approach forces the team to explain an artificial gap every reporting period, eroding trust. It is far better to maintain a clear change log and compare actuals against the current authorized baseline.
A subtle mistake is to confuse actual cost with committed cost. A procurement order for $200,000 worth of steel may have been placed, but if the steel has not been delivered or accepted, that commitment is not yet an actual cost. Including commitments in the actual cost column prematurely inflates the comparison and can provoke a panicked response when none is warranted. Equally dangerous is the tendency to ignore the indirect costs that polite accounting conventions sometimes exclude from project reports. If the project is consuming a disproportionate share of shared services, IT support, or management overhead, the real cost burden is higher than the reported actual cost, and the comparison with planned cost becomes artificially favorable.
Key Insights on Cost Pitfalls
- Underruns can signal problems
- An underrun against planned cost often signals deferred work, unprocessed invoices, or scope that has been quietly reduced, concealing underlying project health issues rather than reflecting genuine efficiencies.
- Update baseline for approved changes
- Failing to rebaseline the cost baseline after approved change requests compares actuals against an outdated target, producing a misleading variance that can undermine stakeholder confidence.
- Rebaselining builds trust
- Organizations that avoid rebaselining to preserve a simplistic before-and-after narrative are forced to explain a persistent artificial gap in every reporting cycle, which gradually erodes confidence in the project's financial reporting.
- Commitments are not actual costs
- Issuing a purchase order creates a financial commitment, but the cost does not become an actual until the goods or services are delivered, inspected, and formally accepted.
- Include indirect cost burdens
- Excluding indirect costs such as shared services, IT support, and management overhead artificially reduces the reported actual cost, creating a deceptively favorable variance that hides the project's full economic impact.
Relationship to Other Project Management Disciplines
The relationship between actual cost and earned value sits at the center of an interconnected web of control processes. Cost comparison does not exist in a vacuum; its signals interact with schedule control, risk management, and change control. When actual cost diverges from planned cost, the first diagnostic step is to check the schedule variance. If the project is ahead of schedule, a higher actual cost may be a natural result of completing work faster. That insight prevents the project manager from applying a blunt cost-cutting measure that would, in fact, slow the team down and harm the delivery date.
Risk management is another close relative. Quantitative risk analysis often models the possible range of actual costs against the baseline, producing a probabilistic forecast. When actual cost breaches the planned value plus contingency reserves, it is a signal that the project’s risk profile has shifted. The risk register should be revisited, and management reserves may need to be tapped. Without a disciplined cost comparison, those risk triggers remain invisible until they erupt into a full-blown crisis.
Forecasting techniques such as Estimate to Complete (ETC) and Estimate at Completion (EAC) rely on the actual cost baseline comparison as their starting point. The EAC formula using the cumulative CPI, for example, multiplies the Budget at Completion by the inverse of the CPI to produce a realistic end cost. If the comparison reveals a CPI of 0.85, meaning the project is delivering 85 cents of value for every dollar spent, the EAC will swell markedly above the original budget. This mathematical linkage demonstrates that the simple act of comparing actual cost to planned cost is the first domino in a chain of decisions that can reshape the entire project trajectory.
Evolution of Cost Comparison Thinking
The evolution of cost management practices has moved the comparison of actual cost to planned cost from a reactive, ledger-based check to a real-time, predictive discipline. In the early days of formal project management, cost comparison meant monthly reconciliation of paper timesheets and invoices against a static budget. Variances were often identified weeks after they occurred, limiting the team’s ability to respond. With the advent of enterprise project management software, actual costs began to be captured almost in real time, and dashboards now alert managers to variances the moment a threshold is crossed.
Yet the more profound shift has been philosophical. Mature organizations have learned that raw cost comparison, while necessary, is insufficient. They now embed it within earned value management, connect it to risk contingency drawdown, and weigh it against value delivery metrics. There is a growing recognition that planned cost is a hypothesis, not a guarantee, and that the comparison is a tool for learning about the true cost of delivering scope in a specific context. Some practitioners advocate for trend analysis over point-in-time snapshots, arguing that a single month’s variance tells you little, but a three-month moving CPI that is trending downward from 0.98 to 0.92 tells you everything. Others debate whether the practice of comparing actual cost to a fixed baseline is even valid in highly uncertain projects, suggesting that rolling wave planning and iterative re-baselining should replace the single baseline model. Regardless of where one stands in that debate, the core act of measuring real expenditure against an agreed plan remains the heartbeat of project financial governance, as essential as a stethoscope to a physician, and just as capable of revealing early trouble that the untrained eye would otherwise miss.
Core Takeaways on Cost Comparison
- Shift from reactive to real-time
- Cost comparison has advanced from monthly paper reconciliations to intelligent dashboards that instantly alert stakeholders to budget variances, enabling swift, data-driven corrective action.
- Philosophical maturity shift
- Mature organizations integrate cost comparison into earned value management, tying it directly to risk contingency drawdown and value delivery metrics to produce a holistic picture of project health.
- Trend analysis over snapshots
- Practitioners rely on trend analysis because a single month's variance offers little context, while a deteriorating three-month moving cost performance index reliably signals emerging systemic issues.
- Fixed baseline questioned
- In high-uncertainty environments, a rigid baseline can misrepresent progress, prompting experts to adopt rolling wave planning and iterative re-baselining that keep cost comparisons aligned with evolving project realities.
