A check sheet is a structured form used in project quality management to collect, record, and categorize data in real time. It is one of the seven basic quality tools often attributed to Kaoru Ishikawa and remains a standard instrument for quality control and process improvement. In project settings, project managers and quality specialists use check sheets to track defect types, frequency counts, process variation, and other performance observations. The format is deliberately simple: a table, grid, or diagram that allows users to mark occurrences rather than write lengthy descriptions. That simplicity is not a limitation; it is the tool's primary strength when used correctly.
Check Sheet: Key Topics Summary
| Key Concept | Summary |
|---|---|
| Definition | A check sheet is a structured, paper-based or digital data collection form used to capture observations in real time at the point where work is performed. |
| Project Management Use | Project managers and quality specialists rely on check sheets to systematically record defect categories, occurrence frequencies, process variation, and related performance metrics during execution. |
| Origins | The check sheet emerged from the mid twentieth century quality control movement, which was driven primarily by manufacturing industries. |
| Ishikawa's Role | Kaoru Ishikawa popularized the check sheet as one of the seven basic quality control tools, intentionally keeping it simple enough for frontline workers who lacked advanced statistical training. |
| Design Approach | The design deliberately separates data capture from advanced analysis, allowing shop floor teams to produce reliable records while engineers and quality analysts interpret the results afterward. |
| Key Components | An effective check sheet includes a clear purpose or title, a defined observation window, predefined categories or locations, simple tally fields, and dedicated spaces for the recorder's name and the date. |
| Applications | Check sheets are applicable across settings, from manufacturing floors to software sprint reviews, provided that categories and tallying rules are agreed on before data collection begins. |
| Visual Counting | The tool provides an immediate visual count, for example revealing how frequently a specific software defect occurs during user acceptance testing. |
What Is a Check Sheet?
A check sheet in project management is defined as a structured, paper-based or digital form designed to collect data at the point where work is performed. The project management profession treats it as a data-gathering and quality control instrument rather than a simple to-do list. PMBOK describes check sheets as a tallying tool used in the Control Quality process to record observed quality data. The form may include rows for defect categories, columns for shifts or time periods, or a schematic of a physical product to mark defect locations.
The core logic behind the tool is not complex. If a project team needs to know how often a certain type of software defect appears during user acceptance testing, a check sheet provides an immediate visual count. Instead of writing "login button did not respond" twenty times, a tester places twenty marks next to a category labeled "login button failure." The value is not in the individual mark but in the pattern that emerges after many marks accumulate. That pattern then feeds other quality tools like Pareto charts and histograms.
A common misconception is to think of a check sheet as a checklist, but a checklist verifies presence or completion, while a check sheet records frequency, category, or distribution. The check sheet also has a different role than a narrative log or an audit report. It sacrifices descriptive richness in exchange for speed and consistency. That trade-off is intentional and useful when the project needs counts more than commentary.
The design of a check sheet typically follows the specific question the project is trying to answer. Questions such as "What defect types are most common?", "Where are defects concentrated?", or "When do failures occur?" each lead to a different layout. This is why experienced quality practitioners advise starting with a clear measurement objective before drawing rows or columns. Without that objective, the sheet collects noise rather than useful data. The tool's simplicity means it can be deployed anywhere from a manufacturing floor to a software sprint review, but only if the categories and tallying rules are agreed upon in advance.
Key Insights on Check Sheets
- Structured quality data-gathering form
- Within the Control Quality process, a check sheet serves as a structured paper or digital form for capturing data at the point of work, functioning as a tallying instrument rather than a simple to-do list.
- Tally marks reveal defect patterns
- Users record tally marks beside predefined categories instead of writing repetitive descriptions, and the accumulating pattern directly feeds downstream quality tools such as Pareto charts and histograms.
- Distinct from a checklist
- A checklist only verifies presence or completion, while a check sheet captures frequency, category, or distribution, and both tools require predetermined categories and consistent tallying rules to produce reliable results.
Origins and Cross-Industry Context
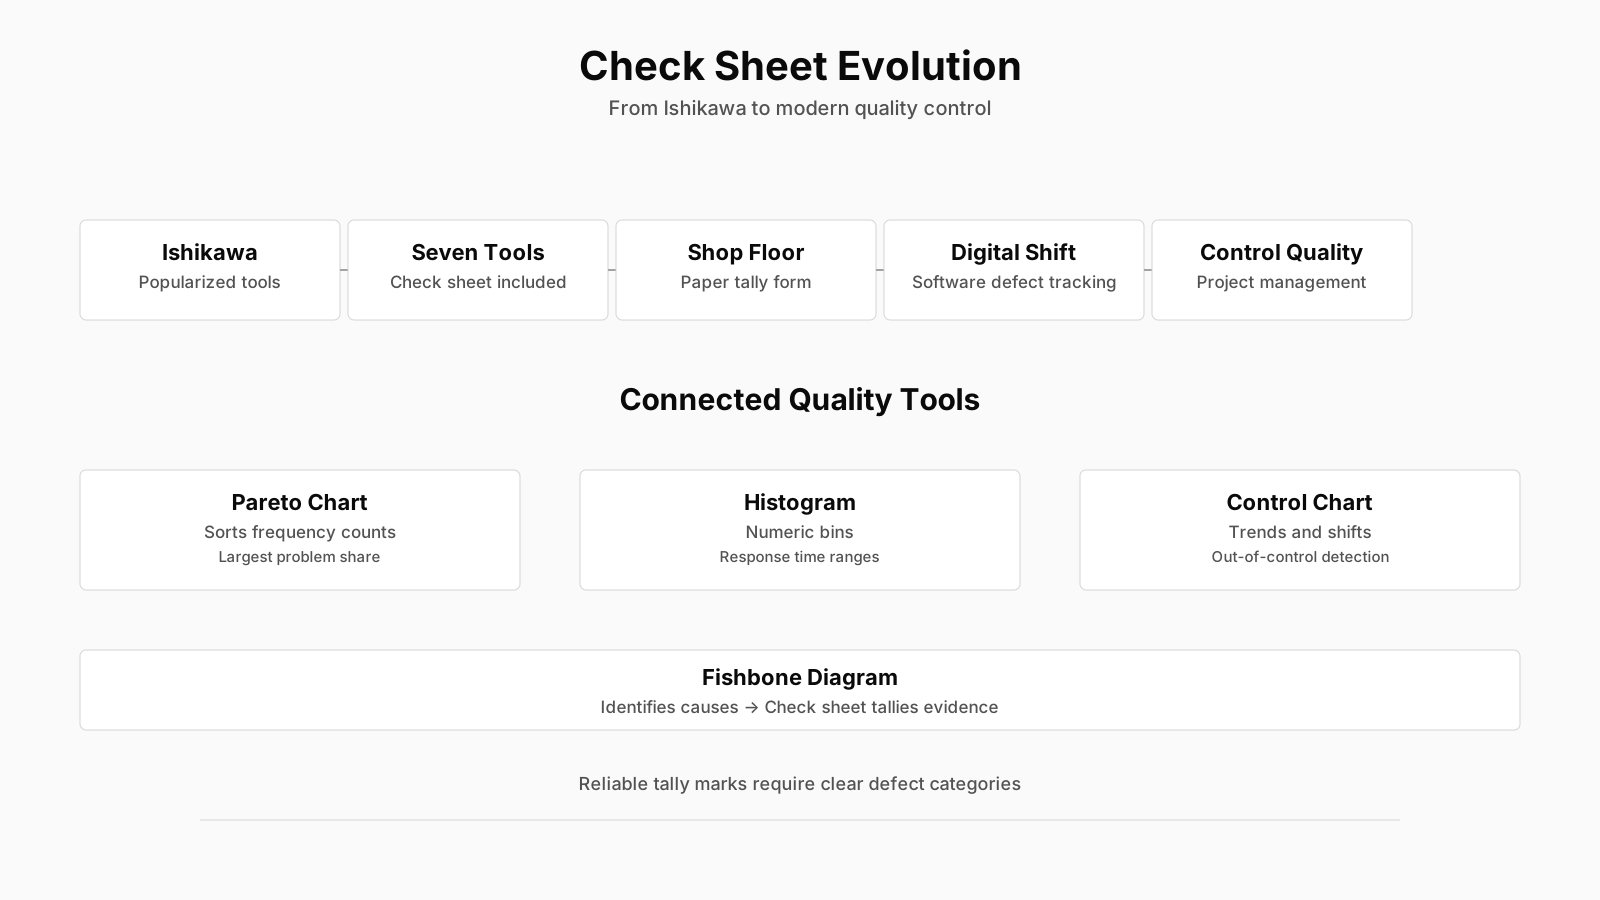
The origins of the check sheet lie in the broader quality control movement that developed in manufacturing during the mid-twentieth century. Kaoru Ishikawa popularized the tool as part of the seven basic quality control tools, which were intended to be simple enough for line workers to use without advanced statistical training. In that context, a check sheet was often called a tally sheet or a defect concentration diagram. The goal was to separate data collection from complex analysis, allowing shop floor teams to gather reliable records while engineers interpreted the results later. This division of labor made quality data collection possible at scale.
Outside project management, check sheets have a long record in aviation safety, healthcare, and pharmaceutical manufacturing. Aviation maintenance crews use them to log recurring component failures across aircraft fleets. Hospitals use structured check sheets to track patient falls, medication errors, or infection control observations. These industries rely on the tool because it imposes a consistent format under time pressure and across many different recorders. The same principle applies when a project is validating deliverables across multiple teams or supplier locations.
The credibility of the check sheet comes from this cross-industry endurance. It is not a project management invention, nor is it a passing agile fad. It is a practical response to a basic problem: humans are inconsistent when they describe events in free text. A structured form reduces that inconsistency and makes counts comparable. Project managers adopt the tool because they inherit lessons from manufacturing and healthcare without needing to translate them into complex software. The check sheet is one of those rare tools that transfers across domains almost unchanged.
Key Components of a Check Sheet
The key components of a check sheet include a clear title, a defined observation period, predefined categories or locations, tally marks, and a space for the recorder and date. Each component serves a specific purpose: the title defines the subject, the period bounds the data, the categories prevent ambiguous classification, and the tally marks make counting immediate. In project management, the observation period might be a sprint, a testing cycle, a shift, or a milestone window. Omitting any of these elements can make the collected data difficult to interpret or impossible to compare across time.
Categories are the most critical design element. They must be mutually exclusive, meaning the same event cannot logically fall into two categories. They also need to be comprehensive enough to capture the meaningful variation without becoming so detailed that recorders hesitate over where to place a mark. For example, a software project check sheet might include categories such as data validation, display error, navigation failure, and performance lag. If a tester encounters a timeout issue, the team needs to know whether to classify it as performance lag or navigation failure. Defining these rules before data collection prevents rework and preserves data integrity.
A well-designed check sheet also includes a place for context. This may be the person recording the data, the time block, the product build, or the specific work area. Context matters because a defect spike in one build may reflect a code merge issue, while the same spike in another build could indicate an environmental problem. Without contextual metadata, the marks alone cannot support a reasoned analysis. This is why many project teams add columns for shift, test environment, user group, or release version.
The physical or digital layout can vary, but the principle remains the same. A paper sheet might have rows for categories and columns for days of the week. A digital check sheet in a project management tool might use dropdown fields and automatic aggregation. The layout is a function of the collection environment. On a construction site, a laminated paper form may be more practical than a mobile app. In a remote software team, a shared spreadsheet or a test management system may be the more natural choice. The component structure does not change, only the medium.
Core Insights on Check Sheet Components
- Five essential components
- A well-designed check sheet combines a clear title, a defined observation period, predefined categories or locations, tally marks, and dedicated fields for the recorder name and date to support consistent, traceable data collection.
- Purpose of each element
- The title identifies the subject being monitored, the observation period sets the temporal boundary for valid data, the categories remove ambiguity from classification, and the tally marks convert observations into an immediately countable record.
- Clear classification rules needed
- Teams should agree on classification boundaries before data collection begins, for example by specifying what qualifies as a timeout in a software project, to avoid inconsistent records and prevent rework.
- Contextual columns enhance analysis
- Including fields for shift, test environment, user group, or release version enables teams to interpret defect spikes accurately, because an identical spike may arise from different root causes in different contexts.
Types of Check Sheets
Several types of check sheets are recognized in quality management, each matched to a different measurement need. The most common is the defect or tally sheet, which records how often specific defect types occur. Another is the location check sheet, which uses a drawing or photograph of a product or workspace to mark where defects appear. There are also process distribution check sheets that record values from a continuous variable, and checklist check sheets that combine verification and tallying. Some practitioners add cause check sheets, which organize observations by potential cause categories such as method, material, machine, and manpower.
The defect tally sheet is the version most often used in software testing and construction punch lists. Its power lies in its direct link to Pareto analysis. If a project team records eight defect types and finds that two account for the majority of marks, the team knows where to focus corrective action. The location check sheet is harder to build because it requires a diagram of the item under inspection. In a building inspection, for example, a floor plan can be used to mark where water leaks or cracks are observed. This spatial pattern can point to structural causes that a simple tally would hide.
Process distribution check sheets collect numerical measurements rather than categorical counts. A team measuring response time during performance testing might record each observed value or place it into a range. This type of check sheet feeds histograms and control charts. It is less common in daily project work but highly useful during quality assurance activities that assess process stability. The checklist check sheet sits at the boundary between a checklist and a check sheet, because it records both whether an item was checked and how many times a condition was observed. That hybrid nature sometimes causes confusion, which is why definitions should be agreed upon before use.
Not every project needs all types. The choice depends on the quality question and the nature of the deliverable. A digital product team may use a defect tally sheet during user acceptance testing and a process distribution check sheet during load testing. A construction project may use a location check sheet for punch lists and a defect tally for material nonconformities. The underlying discipline is the same: define the categories, count consistently, and use the resulting data for analysis rather than as a final answer.
Check Sheet in Project Management and PMBOK
The check sheet in PMBOK is placed within quality management processes, especially Manage Quality and Control Quality. PMBOK identifies check sheets as a data gathering technique used to record observations, defects, or quality attributes. In the Control Quality process, the check sheet supports the measurement of quality performance against the quality management plan. The data collected becomes part of quality control measurements and work performance information. It is not a stand-alone deliverable but an input to future analysis and decision making.
PMBOK Process Alignment
Within predictive project life cycles, the check sheet is most visible during execution and monitoring. The project manager or quality lead defines the categories during quality planning, often with representatives from the affected work streams. During execution, team members and testers complete the check sheet in real time. During monitoring and controlling, the accumulated tallies are examined for trends, outliers, or shifts that may indicate a quality problem. This pattern follows the classic plan-do-check-act cycle. The check sheet does not fix defects; it provides the record that tells the team whether a fix is required and whether a corrective action worked later.
In PMBOK terms, the check sheet is often used alongside statistical sampling, inspections, and audit tools. It is not a replacement for those techniques. A project may use statistical sampling to select which transactions to review and a check sheet to record the findings from those sampled transactions. This combination keeps the data collection effort manageable while still producing structured evidence. Quality management plans sometimes include a blank check sheet as part of the project documents to ensure all teams use the same version.
PRINCE2 Perspective
PRINCE2 does not prescribe a specific check sheet format, but it aligns with the methodology's emphasis on management products and quality recording. In a PRINCE2 project, the Quality Register and quality records serve a similar evidentiary role. A check sheet may support the production of those records by capturing raw observations before they are formalized into quality records. The project manager is responsible for ensuring that quality activities produce sufficient records to support acceptance decisions. The check sheet provides a lightweight mechanism for that purpose.
PRINCE2 also distinguishes between project assurance and quality control. The check sheet is primarily a quality control instrument. It records what was observed and how often, but it does not replace the project board's assurance responsibilities. That separation matters because a well-completed check sheet can give false comfort if the sampling was biased or the categories were poorly chosen. The methodology's focus on defined roles and products helps prevent such misuse when the check sheet is treated as a controlled document rather than an informal note.
Agile and Hybrid Environments
In agile projects, check sheets often appear during sprint reviews, user acceptance testing, and defect triage. A team may use a digital board or spreadsheet to track defect categories discovered during a sprint. The check sheet can also capture recurring impediments, escaped defects, or test automation failures. Because agile teams value transparency and visual management, the tool fits naturally into their workflows. However, the categories need to be lightweight and directly tied to the team's definition of done or acceptance criteria.
Hybrid projects present a slightly different challenge. The predictive side may require formal quality records for stage gates or contractual compliance, while the agile side may rely on team-level data. A check sheet can bridge both worlds if it is designed to satisfy the minimum reporting needs without burdening the team. For example, a hybrid software rollout might use a check sheet in the UAT phase to record defect categories, then summarize the tallies for a gate review. The same data serves the team's retrospective and the sponsor's quality dashboard. That dual use is efficient only when the categories are defined to answer both questions.
Key Takeaways on PMBOK Check Sheets
- Data gathering technique
- PMBOK positions check sheets as a structured data gathering technique within the Control Quality process, used to systematically record observations, defects, and quality attributes during inspections.
- Input, not a deliverable
- A check sheet functions as an analytical input rather than a standalone project deliverable, supplying structured evidence for quality performance reviews and corrective decisions.
- Defined in planning, used in execution
- Quality leads establish the check sheet categories during quality planning, while team members capture observations in real time during execution and review the tallies during monitoring to detect trends, patterns, or process shifts.
- PRINCE2 quality alignment
- Although PRINCE2 does not mandate a specific check sheet format, the technique supports its focus on management products and the disciplined recording of quality evidence.
Purpose and Importance of a Check Sheet
The purpose of a check sheet in project management is to provide a consistent, low-friction method for collecting structured quality data. That purpose has several dimensions. First, it standardizes how different people record observations, reducing variability in language and judgment. Second, it makes data visible as it accumulates, allowing early detection of patterns. Third, it preserves an audit trail of quality events for later analysis or compliance. Fourth, it reduces the administrative load on specialists, because marking a sheet is faster than writing a narrative report.
The importance of the tool becomes apparent when projects handle large volumes of repetitive inspection work. A tester executing hundreds of test cases, a site engineer reviewing dozens of installation points, or a call center migration team validating data records all need a way to capture exceptions without interrupting the work. The check sheet satisfies that need. It turns observation into data without a separate transcription step. The collected tallies can then be converted into defect densities, failure rates, or Pareto distributions. Without structured collection, those analyses rely on memory or inconsistent email threads.
Another often overlooked benefit is objectivity. When categories are defined in advance, a recorder is less likely to apply personal interpretation. Two testers may describe the same software problem differently in free text. A check sheet forces them to choose among agreed categories, which makes their observations comparable. Objectivity is not absolute, of course, because category definitions still involve judgment. But the tool constrains that judgment enough to improve reliability. This is why user acceptance testing often pairs a check sheet with a brief definition of each defect category.
The check sheet also has a psychological effect on teams. Seeing marks accumulate can make an abstract quality problem feel concrete and urgent. A team that sees twenty marks next to "database timeout" on a visible chart may act sooner than a team that receives a weekly report saying "some users experienced timeouts." That visibility supports the agile principle of transparency and the predictive principle of performance measurement. It does not solve the problem by itself, but it changes the quality of the conversation.
From a BVOPM perspective, quality data collection gains additional structure when defect analysis uses predefined root-cause categories. A check sheet can capture those categories directly, feeding product risk management activities that quantify loss size and apply dynamic filtering. This does not change the basic operation of the check sheet; it simply positions it within a value-oriented quality system.
Practical Application in Project Work
Practical check sheet examples in project management span software testing, construction punch lists, supplier audits, and operational readiness reviews. In a software project, a UAT check sheet might list defect categories such as data validation, workflow error, UI defect, and security finding. Testers mark each failed test case against one category. In construction, a punch list check sheet might use a floor plan diagram to note cracks, missing fixtures, or paint defects by location. In supplier quality management, incoming inspection teams might use a check sheet to record packaging damage, labeling errors, or dimensional defects across delivered lots.
The tool appears most frequently during execution and monitoring phases. Planning may define categories and formats, but the actual recording happens when deliverables are produced, tested, or inspected. The data then feeds performance reports, quality control measurements, and change requests if corrective action is necessary. Project managers often review the sheets at daily or weekly quality meetings. The sheets become evidence for decisions about whether to accept a deliverable, rework a component, or escalate a systemic issue.
Who uses a check sheet depends on the project context. In predictive projects, the quality assurance team, inspectors, testers, and work package owners are the primary users. In agile projects, developers, testers, and product owners may all contribute during acceptance testing. The project manager's role is usually to ensure the sheet exists, categories are clear, and the data is reviewed consistently. In regulated environments, a quality engineer may own the form and control revisions. That ownership matters because uncontrolled versions can lead to inconsistent data and audit findings.
One practical challenge is balancing speed and accuracy. If the check sheet is too complex, people will avoid it or enter marks in the wrong category. If it is too simplistic, it may fail to capture meaningful distinctions. Experienced practitioners often pilot a check sheet on a small scale before full deployment. They refine categories based on the first few uses, then freeze the version for the remaining data collection period. This pilot step is not formal project management doctrine, but it is common practice in quality-conscious organizations.
Practical Check Sheet Deployment Insights
- Context-specific check sheet designs
- Software UAT sheets are structured to classify defects such as data validation errors, security findings, and usability issues; construction punch lists use annotated floor plan diagrams to pinpoint spatial deficiencies; and supplier inspection sheets track packaging, labeling, and dimensional nonconformities across delivered lots.
- Data captured during execution
- Check sheets are completed at the moment of production, testing, or inspection, and the resulting data directly informs performance reports, quality control measurements, and change requests whenever corrective action becomes necessary.
- Clear user and manager roles
- In predictive projects, quality assurance teams, inspectors, testers, and work package owners are the primary users of check sheets, while the project manager ensures that the sheet is available, that defect categories are unambiguous, and that data is reviewed on a consistent basis.
Check Sheet vs Checklist and Other Quality Tools
The most frequent point of confusion is the check sheet vs checklist distinction. A checklist verifies that an item or condition meets a requirement; it produces a yes or no result. A check sheet tallies how often something occurs across categories, locations, or time periods. A project might use a checklist to confirm that a server has been patched and a check sheet to record how many server failures occurred by failure type. Both are valid quality tools, but they answer different questions. Confusing them leads to data that neither verifies completion nor reveals patterns.
A check sheet also differs from a Pareto chart, even though the two are closely linked. The check sheet collects raw counts; the Pareto chart displays those counts in descending order to highlight the vital few categories. A histogram shows the distribution of numerical values, while a run chart or control chart tracks performance over time. A cause-and-effect diagram organizes potential causes but does not count occurrences. The check sheet often precedes these analytical tools, providing the data they visualize or analyze.
The relationship with inspections and audits also deserves attention. An inspection is the act of examining a deliverable or process. A check sheet is a structured way to record what the inspection finds. An audit may review the check sheets themselves to verify that quality controls are being performed. In that sense, the check sheet is both an output of inspection and an input to audit. This layering is common in regulated industries, where auditors want to see raw data behind summary reports. The check sheet satisfies that evidentiary need without requiring complex reporting systems.
Because the check sheet is simple, some project managers assume it can replace a quality management system. It cannot. It is one data collection instrument among many. It does not assign responsibilities, define acceptance criteria, or control document versions by itself. It works best as part of a broader quality plan that includes defined metrics, roles, review cycles, and analytical tools. A standalone check sheet without follow-up analysis or action is just a piece of paper or a forgotten spreadsheet tab.
Common Challenges and Misconceptions
Several common misconceptions about check sheets reduce their usefulness in real projects. One is the belief that more categories automatically produce better insight. In practice, too many categories create hesitation and inconsistent classification. Another misconception is that a check sheet identifies the root cause of defects. It does not. It shows frequency and pattern, but root cause analysis requires additional techniques such as the five whys, fishbone diagrams, or fault tree analysis. Treating the check sheet as an analytical conclusion rather than a data collection step is a frequent source of project quality failures.
Design flaws often emerge when categories overlap. If a software defect can be classified as both "UI error" and "workflow error," different testers will choose differently. The resulting tallies become unreliable. To prevent this, teams need decision rules for ambiguous cases. For example, if a user cannot proceed because a button is missing, the team must decide in advance whether that is a UI issue or a workflow issue. This may sound tedious, but it is exactly the kind of operational clarity that distinguishes reliable quality data from anecdotal evidence.
Recording bias is another challenge. People may avoid marking a category that makes their team look bad, or they may over-report low-severity issues to appear thorough. A check sheet cannot eliminate human bias, but it can reduce it when categories are objective and recorders are not penalized for honest reporting. Project culture plays a significant role. If quality data is used punitively, the sheet will be gamed. If it is used for improvement, the data will be more trustworthy. This is a management reality, not a tool limitation.
There are also situations where a check sheet should not be used. If the team is exploring an unknown problem with no clear categories, open-ended observation or interviews may be better first steps. If the frequency is very low and each event is unique, a structured tally may obscure important context. If the team cannot commit to consistent recording, the data will be incomplete and potentially misleading. In those cases, the check sheet adds process weight without adding insight. Experienced project managers recognize these limits and choose the tool accordingly.
Key Insights on Check Sheet Pitfalls
- Excessive categories breed inconsistency
- An overabundance of classification options leads to hesitation and inconsistent recording, so keep categories limited, mutually exclusive, and clearly defined before data collection begins.
- Check sheets reveal patterns, not causes
- A check sheet captures frequency and distribution patterns, but identifying underlying causes requires structured root cause methods such as the five whys, fishbone diagrams, or fault tree analysis.
- Data collection, not final conclusion
- A common quality failure occurs when teams treat the completed check sheet as the final analysis rather than as a structured data collection step that precedes deeper investigation.
- Ambiguous categories invite recorder bias
- When a defect could reasonably fit multiple categories, such as both a UI error and a workflow error, teams should define boundaries in advance; objective category definitions and honest reporting practices help reduce recorder bias.
Evolution and Current Thinking
The modern use of check sheets has shifted from paper forms to digital data collection in spreadsheets, test management tools, and project dashboards. Many project management and issue tracking platforms include customizable fields that mimic the function of a check sheet. Teams can define defect categories, statuses, and priorities, then generate frequency reports automatically. This eliminates manual tallying and reduces transcription errors. Real-time dashboards can display check sheet data as it accumulates, giving project managers and sponsors immediate visibility into quality trends.
Digitalization has not changed the underlying logic. Categories still need to be mutually exclusive, data still needs context, and the results still need analysis. Some teams assume a software tool will automatically fix poor category definitions, but it will not. A dropdown menu with ambiguous options is still ambiguous. The medium changes, but the measurement discipline remains. This is a point that experienced quality practitioners emphasize when introducing new digital forms.
Current thinking also connects check sheets to broader data quality and analytics movements. The structured data from a check sheet can feed machine learning models that detect unusual patterns or predict defect risk. In some industries, sensors and automated systems now capture data that used to require manual check sheets. A server monitoring system may automatically log error types at frequencies that no human could tally. The check sheet concept survives as a mental model: define categories, record occurrences, and use the pattern to act.
Debates about the check sheet usually focus on whether it remains relevant in automated environments. Some argue that real-time telemetry and issue trackers make manual check sheets obsolete. Others point out that human judgment is still needed to classify ambiguous events, especially in fields like construction, healthcare, and user acceptance testing. The reasonable position is that the check sheet has evolved rather than disappeared. It persists as a structured data collection pattern, whether on paper, in a spreadsheet, or embedded in an application.
In all these settings, the core principle remains: the data is only as good as the definitions behind the marks. A check sheet that is thoughtfully designed, consistently used, and properly analyzed gives a project team a reliable picture of quality performance. A poorly designed sheet creates noise and false confidence. That tension, between simplicity and discipline, is what makes the check sheet an enduring tool in project management practice.
