Delivery measurements, in project management, refer to the quantitative and qualitative indicators used to assess whether project outputs, work products, and intended benefits are being completed and delivered according to the agreed parameters of scope, schedule, cost, quality, and value. The term encompasses far more than tracking deadlines. It includes evidence that deliverables exist, are fit for use, have been accepted, and are contributing to the outcomes that justified the project.
A project team may report high activity, but delivery measurements answer the harder question of what has actually been handed over and whether that handover meets expectations. In predictive environments these measures often attach to baselines and formal acceptance. In adaptive environments they attach to working increments, flow, and customer feedback.
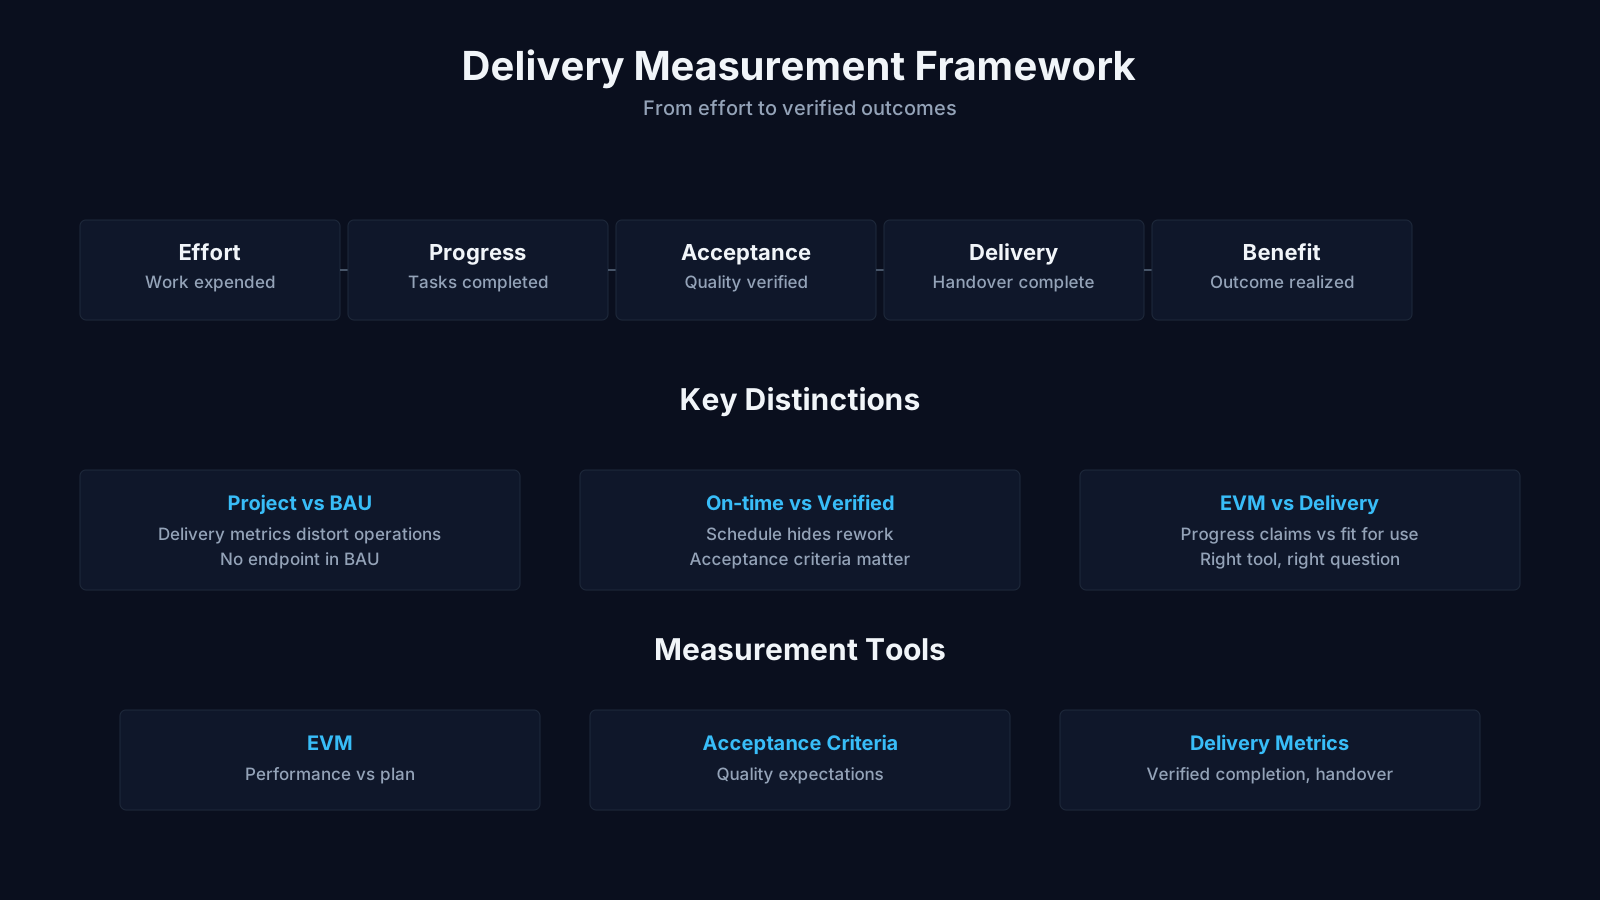
Delivery Measurements: Key Topics at a Glance
| Key Concept | Summary |
|---|---|
| Definition | Delivery measurements are quantitative and qualitative indicators that verify whether project outputs, work products, and intended benefits have been completed and handed over in accordance with agreed scope, schedule, cost, quality, and value parameters. |
| Evidence Basis | They emphasize verified handoffs and accepted outcomes rather than reported activity. A schedule update qualifies as a delivery measurement only when it is linked to actual installed units that have been inspected and formally accepted. |
| Project Level | At the project level, delivery measurements monitor concrete outputs such as completed code modules, approved design packages, constructed facilities, and formally accepted documentation. |
| Program Context | Within programs and portfolios, delivery measurements confirm whether aggregated outputs and benefits are advancing toward the strategic results that justified the investment. |
| Performance Measurement | Delivery measurements differ from broader performance measurement, which may also include team utilization, process compliance, employee engagement, and operational efficiency. |
| Origins | The concept emerged from manufacturing, logistics, and engineering disciplines and was formalized in large government and defense initiatives during the 1960s to integrate scope, schedule, and cost performance. |
| Earned Value | Earned value is a specific technique that operationalizes the core intent of delivery measurements: replacing subjective progress claims with verifiable delivery data. |
| Common Metrics | Predictive delivery environments commonly track planned versus actual milestone achievement, deliverable acceptance rates, schedule variance, cost variance, and quality audit results as core delivery metrics. |
What Is Delivery Measurements? Definition and Core Meaning
A useful delivery measurements definition describes the set of evidence based indicators used to determine whether project work is progressing toward agreed results. These indicators cover deliverable completion, milestone achievement, acceptance rates, quality outcomes, and the realization of intended benefits. They exist to make delivery visible, comparable, and manageable rather than leaving it to subjective status reports.
Delivery measurements are not the same as effort, activity, or utilization metrics. A team can be extremely busy and still fail to deliver anything of value. The core meaning therefore centers on completed work that has been validated or accepted by the relevant authority. This distinction matters because many project problems remain hidden behind activity based reporting.
Consider a contractor installing HVAC systems in an office building. A schedule update that says installation is 90 percent complete is not yet a delivery measurement unless that percentage is tied to actual units installed, inspected, and accepted. The measurement becomes meaningful when it answers what has been handed over and whether it works. That simple shift from reported progress to verified delivery lies at the heart of the concept.
Delivery Measurements in Project, Program, and Portfolio Context
At the project level, delivery measurements track specific outputs such as completed code modules, approved designs, constructed facilities, or accepted documentation. They are usually collected during execution and monitoring, then compared against the project management plan. At the program level, the focus broadens to capability delivery across multiple projects and the integration of outputs into operational use. Portfolio level delivery measurements emphasize whether funded investments are producing the expected strategic value and whether the overall mix of initiatives is healthy.
Distinguishing Delivery Measurements from Performance Measurement
Performance measurement is a broader discipline that can include team utilization, process compliance, employee engagement, and operational efficiency. Delivery measurements form a subset of performance measurement focused specifically on the completion and acceptance of outputs. The two overlap, but they are not interchangeable. A high performing team that meets all internal process standards can still miss delivery targets if the outputs are not accepted or do not create value.
Core Insights on Delivery Measurement
- Evidence-based progress indicators
- Delivery measurements form a set of evidence based indicators that determine whether project work is advancing toward agreed results and intended outcomes.
- Coverage of key project dimensions
- These indicators span deliverable completion, milestone achievement, acceptance rates, quality outcomes, and the realization of intended benefits, and they provide a complete view from outputs to outcomes.
- Distinct from activity metrics
- Delivery measurements differ from effort, activity, and utilization metrics because a team can remain highly active without producing any validated business value.
- Validated work at the core
- The core principle focuses on completed work that has been validated or accepted by the relevant authority, rather than relying on subjective status reports.
- Concrete acceptance requirement
- A schedule update reporting 90 percent installation does not qualify as a delivery measurement unless it is linked to actual units that have been installed, inspected, and accepted.
Origins and Cross-Industry Context of Delivery Measurements
The origins of delivery measurements are rooted in manufacturing, logistics, and engineering disciplines where physical output had to be quantified for planning and quality control. Concepts such as throughput, defect rate, on time delivery, and acceptance criteria migrated into project management as projects became more complex and accountable. These industrial practices demonstrated that measuring only effort or cost was insufficient without measuring what was actually produced.
In logistics, delivery measurement has long included on time in full metrics that assess whether shipments arrive complete and undamaged. Manufacturing uses yield and first pass quality to indicate whether production output is usable. Software engineering later contributed cycle time, throughput, and defect escape rate. Each of these traditions influenced the way project managers now think about delivery.
Earned value management provides the most formal project management expression of this lineage. It emerged from large government and defense programs, particularly in the United States during the 1960s, where the need to integrate scope, schedule, and cost performance was acute. Although earned value is a specific technique, it reflects the same underlying impulse to replace subjective progress claims with verifiable delivery data.
How Cross-Industry Practices Shape Project Delivery Measurement
Cross-industry practices shaped project delivery measurement by introducing the idea that output must meet predefined conditions before it counts as delivered. A manufactured part is not delivered if it fails inspection. A software feature is not delivered if it contains critical defects. A project deliverable is not delivered simply because a task is marked complete. The measurement therefore includes acceptance and quality conditions, not just completion status.
Key Components and Types of Delivery Measurements
The key components of delivery measurements generally include scope completion, timeliness, cost efficiency, quality, and value realization. Scope completion measures how many planned outputs are finished and accepted. Timeliness compares actual delivery dates against planned or committed dates. Cost efficiency examines the financial resources consumed per delivered output. Quality indicates whether deliverables meet requirements and are fit for use. Value realization assesses whether the delivered outputs are producing the intended benefit.
These components are not independent. A project can deliver on time and under budget while failing scope or quality. The real diagnostic power of delivery measurements comes from observing the relationships among them. For example, a sudden increase in scope completion accompanied by a decline in quality often signals that pressure to hit deadlines is overriding verification activity.
Output, Outcome, and Benefit Measurements
Output measurements confirm that a deliverable was produced and accepted. Outcome measurements assess whether the deliverable changes user behavior or operational performance. Benefit measurements evaluate whether those changes translate into business value such as revenue, cost savings, or reduced risk. A software system may be delivered on time as an output, but if users do not adopt it, the outcome and benefit are not realized.
Leading and Lagging Delivery Indicators
Leading indicators provide early signals about future delivery performance. They include remaining work, blocker counts, cycle time trends, and milestone proximity. Lagging indicators confirm what has already happened, such as accepted deliverables, milestone slippage, rework rates, and final benefit results. Leading indicators are useful for intervention, while lagging indicators are useful for accountability and learning.
Common Delivery Metrics Across Methodologies
Predictive projects commonly use planned versus actual milestone dates, deliverable acceptance rates, schedule variance, cost variance, and quality audit results. Agile projects use velocity, throughput, cycle time, lead time, burndown and burnup charts, cumulative flow diagrams, and escaped defect counts. Hybrid environments typically combine milestone based controls with flow based indicators, depending on the nature of the work and the governance requirements.
Core Takeaways on Delivery Metrics
- Five measurement components
- Delivery performance is most effectively assessed through five dimensions: scope completion, timeliness, cost efficiency, quality, and realized business value.
- Interlocking diagnostic power
- The diagnostic value lies in analyzing relationships among the metrics, for example when scope completion rises while quality falls, it typically indicates that deadline pressure is weakening verification.
- Predictive project metrics
- In predictive project environments, delivery health is tracked through planned versus actual milestone dates, deliverable acceptance rates, schedule variance, cost variance, and quality audit findings.
- Agile project metrics
- Agile teams typically measure delivery performance using velocity, throughput, cycle time, lead time, burndown and burnup charts, cumulative flow diagrams, and escaped defect counts.
- Context-specific measurement choice
- The appropriate delivery metrics depend on the project methodology, since predictive and agile approaches each favor distinct indicators that reflect their respective planning and control mechanisms.
Delivery Measurements in PMBOK, PRINCE2, and Agile
Delivery measurements in project management frameworks appear under different names, but they serve the same fundamental purpose of confirming that planned work has been completed and accepted. Each framework embeds the concept within its own control structures, language, and cadence. Understanding these variations helps practitioners apply delivery measurements consistently across different delivery environments.
PMBOK Perspective
In the PMBOK Guide, delivery measurements are embedded in processes such as Validate Scope and Control Quality. Validated deliverables move through quality control, while accepted deliverables are formally signed off by the customer or sponsor. Work performance data, work performance information, and work performance reports provide the reporting chain that turns raw progress data into meaningful delivery insights.
The PMBOK Guide Seventh Edition reframes this within the Delivery Performance Domain. The emphasis shifts from process compliance to outcomes, value, quality, and stakeholder expectations. Delivery measurements in this view are not just about schedule and cost. They also address whether the project is producing usable results and whether the team is adapting to emerging information.
PRINCE2 Perspective
PRINCE2 manages delivery through controlled stages, tolerances, and formal management products. Delivery measurements appear in the quality register, product status account, checkpoint reports, highlight reports, and end stage reports. Each product has a product description with quality criteria, and the project manager uses stage boundaries to assess whether delivery remains within tolerance.
PRINCE2 does not mandate a single measurement formula such as earned value. Instead, it emphasizes continued business justification and control by exception. Delivery measurements support this by providing the evidence needed to decide whether to escalate an exception, adjust a stage plan, or request a project board decision.
Agile and Hybrid Perspective
Agile delivery measurements focus on working product increments, customer feedback, and sustainable flow. Velocity, cycle time, throughput, lead time, and cumulative flow are common. Delivery is confirmed when a product increment meets the definition of done and is potentially releasable. Agile teams also measure value delivery through customer satisfaction, adoption, and business outcomes rather than relying solely on schedule variance.
Hybrid projects combine predictive governance with adaptive delivery. A hybrid team may report earned value to a steering committee while using cycle time and burndown internally. The challenge is avoiding duplication and ensuring that both measurement sets describe the same reality. When the two sets conflict, it usually indicates that work is being measured at different levels or with inconsistent definitions.
BVOP Perspective
Business Value-Oriented Project Management adds a distinct interpretation by treating delivery measurements as evidence of value realization rather than schedule adherence alone. It tracks Business Value Points over time, and a persistent decline can signal the need for project closure or reset. It also captures process damage and waste categories such as overwork, perfectionism, and rejected acceptable work, which are often invisible in conventional delivery reports.
Purpose and Importance of Delivery Measurements in Project Management
The importance of delivery measurements lies in their ability to convert abstract progress claims into concrete evidence for decision making. Without them, project managers rely on intuition, team optimism, or incomplete status updates. Delivery measurements provide the feedback loop that allows corrective action before small deviations become project failures.
They also create transparency for sponsors, customers, regulators, and other stakeholders. A well structured delivery measurement system shows what has been completed, what remains, and whether the remaining work is stable or growing. This transparency builds confidence and reduces the frequency of surprise escalations.
Delivery measurements serve an early warning function as well. A widening gap between planned and actual delivery dates, a rising defect rate, or a decline in throughput often precedes a major schedule or cost problem. Recognizing these patterns early is generally cheaper and less disruptive than discovering them at a formal milestone review.
Supporting Governance and Decision-Making
Governance bodies such as steering committees and project boards rely on delivery measurements to make stage gate, investment, and escalation decisions. They need to know whether the project is delivering what was promised and whether the remaining work justifies continued funding. Delivery measurements provide that evidence in a format that can be compared across projects and over time.
Baseline Comparison and Variance Analysis
In predictive projects, delivery measurements are compared against baselines to produce variances. Schedule variance and cost variance are classic examples, but deliverable acceptance variance is equally important. A project can be on schedule and still have no accepted deliverables if quality gates are being skipped or deferred. Baseline comparison therefore works best when it includes scope and quality, not only time and cost.
Core Insights on Delivery Metrics
- Evidence based decision making
- Delivery metrics turn subjective progress claims into objective evidence, giving decision makers a reliable factual base that reduces dependence on intuition and anecdotal reporting.
- Corrective action feedback loop
- Well-designed delivery metrics create a closed feedback loop that exposes emerging deviations early, enabling teams to correct course before minor variances become schedule slips or budget overruns.
- Stakeholder transparency and trust
- Consistent delivery metrics give sponsors, customers, regulators, and other stakeholders a transparent view of completed work, remaining scope, and whether outstanding effort is stable or increasing, which strengthens confidence in delivery commitments.
- Early warning failure signals
- Leading indicators such as a widening gap between planned and actual delivery dates, rising defect rates, or falling throughput often signal schedule and cost pressure before formal milestones are missed, making early intervention considerably less expensive.
- Governance and baseline support
- Governance bodies depend on delivery metrics to make informed stage gate, investment, and escalation decisions, while plan-driven projects use the same measurements for baseline comparisons and variance analysis.
Practical Application of Delivery Measurements
In practice, delivery measurements in practice begin with defining measurable completion criteria during planning and continue through execution, monitoring, and closing. Teams collect progress data, validate deliverables against quality criteria, obtain acceptance, and then compare results to expectations. The measurements only work when the definition of done is clear and consistently applied.
A software implementation project might measure configuration completion, data migration success, user acceptance testing results, and production cutover readiness. A construction project might measure concrete pours completed, inspections passed, and rooms handed over. The specific measures depend on the industry and the nature of the deliverables, but the pattern remains the same.
Delivery measurements are usually reported through dashboards, stage reports, and review meetings. The frequency of collection reflects the pace of the project. A long duration capital project may measure at monthly intervals, while an agile team may measure daily. The key is that the measurement cycle matches the speed at which decisions must be made.
Use Across the Project Lifecycle
During initiation, delivery measurements help establish feasibility and define what success will look like. During planning, they are translated into baselines, thresholds, and reporting formats. During execution, they provide real time feedback on work completion and quality. During monitoring and controlling, they trigger variance analysis and change requests. During closing, they support final acceptance, lessons learned, and benefit handover.
Who Uses Delivery Measurements
Project managers use delivery measurements to manage day to day execution and forecast completion. Team members use them to understand whether their work meets expectations. Sponsors and portfolio managers use them to compare progress across initiatives and make investment decisions. Customers and users use them indirectly through acceptance and satisfaction assessments. Each audience needs a different level of detail, but all rely on the same underlying evidence.
Common Challenges, Pitfalls, and Misconceptions in Delivery Measurements
Many common delivery measurement challenges arise from measuring activity instead of output, confusing output with outcome, or collecting too many metrics without a clear decision purpose. Teams sometimes report started tasks as completed, or measure story points without validating that the resulting product increment is usable. These practices create a false sense of progress and delay corrective action.
Data quality is another persistent issue. Manual status updates can be optimistic or inconsistent. Different teams may interpret completion criteria differently. A deliverable that one team considers done may fail another team’s quality checks. Without clear definitions and regular calibration, delivery measurements can mislead rather than inform.
Gaming is also a real risk. Teams may inflate velocity, split work items to increase throughput, or delay acceptance testing to protect milestone metrics. These behaviors are rational responses to poorly designed incentives. Delivery measurement systems should therefore be designed with an awareness of how people react when numbers are tied to performance evaluation.
Misconceptions About Delivery Measurements
A common misconception is that delivery measurements only concern schedule. In reality, they include scope acceptance, quality, and value. Another misconception is that more metrics produce better control. In practice, a small set of well defined indicators tied to decisions is usually more effective than a large dashboard of poorly understood numbers.
When Not to Overemphasize Delivery Measurements
Delivery measurements can be counterproductive in highly exploratory work where the outcome is not yet clear. Early research, design discovery, and innovation projects may not have stable output definitions. Imposing rigid delivery metrics too early can push teams toward false certainty and premature convergence. In such situations, learning and hypothesis validation metrics may be more appropriate than deliverable acceptance counts.
Core Takeaways on Measurement Pitfalls
- Activity versus actual output
- When teams measure hours logged or tasks started instead of completed deliverables, they create an illusion of progress that masks stagnation and postpones the adjustments needed to deliver real value.
- Unvalidated completion reporting
- Progress signals become unreliable when teams mark work as complete before the increment is tested and usable, or when they treat story point velocity as evidence of delivery without verifying that the product meets acceptance criteria.
- Unreliable data quality
- Decision quality deteriorates when status data relies on manual updates and teams apply inconsistent definitions of done, so leaders need clear completion standards and periodic calibration to keep metrics comparable.
- Gaming tied to evaluation
- When velocity or similar metrics influence performance reviews, individuals often respond by inflating estimates, fragmenting work packages, or deferring acceptance checks, which means measurement systems should be designed with these behavioral responses in mind.
Relationship to Other Project Management Concepts
The distinction between delivery measurements vs key performance indicators is often misunderstood. Key performance indicators are broad organizational or project measures that can include financial health, customer loyalty, safety, and employee engagement. Delivery measurements are more narrowly focused on whether project outputs are completed, accepted, and fit for use. A delivery measurement can be a key performance indicator, but not every key performance indicator is a delivery measurement.
Delivery measurements also connect to progress reporting, stage gate reviews, quality management, and change control. They supply the evidence base for formal reports and informal conversations. Without delivery measurements, progress reports often become lists of activities, which tell stakeholders little about whether the project is actually delivering anything.
Delivery Measurements and Earned Value Management
Earned value management is a specialized form of delivery measurement that integrates scope, schedule, and cost using planned value, earned value, and actual cost. It produces indices such as schedule performance index and cost performance index. While powerful for large predictive projects, earned value is not always suitable for small, exploratory, or agile efforts. Delivery measurements are the broader category within which earned value sits.
Delivery Measurements and Benefits Realization Management
Benefits realization management extends beyond project closure to confirm that delivered outputs achieve intended business outcomes. Delivery measurements provide the early evidence that outputs exist and are accepted. Benefits measurements then assess what happens after acceptance. The two are sequential but connected. A project cannot realize benefits if the underlying deliverables are not delivered to the required standard.
Delivery Measurements and Risk and Quality Management
Delivery measurements also feed risk and quality management. A rising defect rate is a quality issue and a risk indicator. A growing backlog of incomplete deliverables can signal schedule risk. By tracking delivery measurements over time, project managers can detect emerging threats earlier and direct risk responses where the evidence points.
Evolution and Current Thinking in Delivery Measurements
Modern delivery measurements increasingly emphasize flow, value, and outcomes rather than simple time and cost variance. The shift reflects the growing influence of agile, lean, and DevOps practices, which treat delivery as a continuous flow of value rather than a sequence of isolated milestones. Teams now measure lead time, cycle time, throughput, and customer satisfaction alongside traditional schedule and budget indicators.
There is also growing recognition that delivery measurements must be fit for purpose. A standard set of metrics imposed uniformly across all projects rarely works. The nature of the work, the level of uncertainty, the governance environment, and the stakeholder information needs should influence which measurements are selected and how they are reported.
Debates continue about the usefulness of velocity and story points as delivery measurements. Some practitioners argue that they are relative team measures and should not be used for cross team comparison or external reporting. Others favor throughput and cycle time because they are based on actual completed items and elapsed time. Neither view is universally correct, but the debate has improved awareness of how easily delivery metrics can be misused.
Debates and Schools of Thought
One school of thought holds that delivery measurements should focus on accepted outputs and business outcomes, not intermediate activity. Another argues that leading indicators such as remaining work and blocker counts are more actionable because they permit intervention before problems harden. Most experienced practitioners blend both perspectives, using lagging indicators for accountability and leading indicators for course correction.
The Current Direction
Current practice is moving toward real time dashboards, automated data collection, and value stream based metrics. These tools reduce manual reporting burden and improve timeliness, but they do not remove the need for clear definitions and human judgment. A delivery measurement is only as useful as the decision it supports and the consistency with which it is understood across the team.
Key Insights on Delivery Measurement Evolution
- Shift toward flow and value
- Modern delivery measurement increasingly emphasizes flow efficiency, value realization, and business outcomes rather than relying primarily on traditional time and cost variance.
- Context driven metric selection
- A uniform set of metrics imposed across all projects rarely succeeds because the nature of the work, its level of uncertainty, the governance environment, and specific stakeholder information needs should determine what gets measured.
- Debate over metric focus
- One perspective emphasizes accepted outputs and realized business outcomes, while another argues that leading indicators such as remaining work and blocker counts enable earlier intervention before problems become entrenched.
- Move toward automated real time tracking
- Current practice is shifting toward real time dashboards, automated data collection, and value stream metrics, yet clear definitions and human judgment remain essential for meaningful interpretation.
