Defining risk probability and impact sits at the very heart of qualitative risk analysis, yet many project teams rush through this step without grasping how much it shapes every subsequent decision. When you ask how to define risk probability and impact for qualitative risk analysis, you are really asking how to transform vague anxieties about the future into structured, comparable assessments that a project manager can act on. Without a clear set of definitions, the entire risk register becomes a collection of gut feelings dressed up as data, and the prioritization that follows will be unreliable at best. The source material for this discussion provides a rigorous set of example scales for probability and impacts across cost, time, scope, and quality, and those concrete thresholds will ground the article that follows. But before we examine those numbers, it helps to locate this activity within the wider architecture of project risk management and to understand why the definitional work done during planning is the quiet foundation of effective risk response.
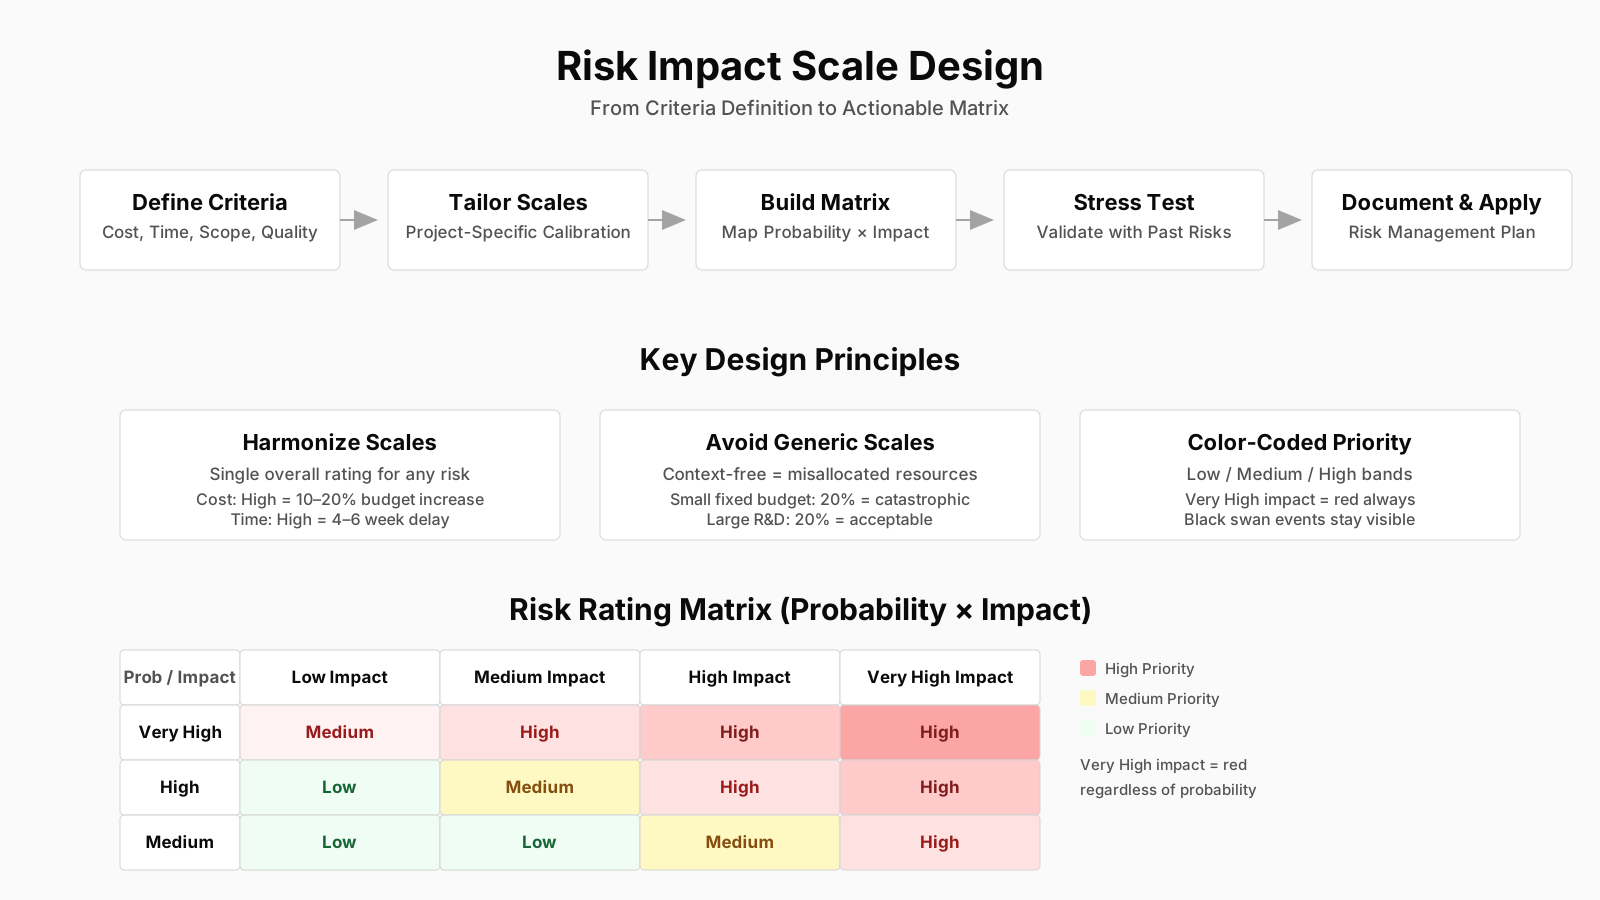
Summary Table: Defining Risk Probability and Impact
| Key Concept | Summary |
|---|---|
| Qualitative Analysis | Qualitative Risk Analysis subjectively assesses individual risks and prioritizes them by combining probability and impact, focusing on the most significant threats and opportunities. |
| Definitional Foundation | Establishing shared definitions for terms such as "high probability" or "severe impact" is essential to meaningfully rank and compare risks within a specific project context. |
| Probability Scaling | Example probability scales use nonlinear values, such as 0.15 for Moderate, to reflect typical distributions where most risks are low probability, while rare serious threats spike sharply. |
| Cost Impact | Cost impact levels are defined by percentage increases, with weights spanning from 0.03 for Very Low marginal overruns to 0.60 for Very High when increases exceed 28%. |
| Time Impact | The time impact scale applies comparable tiered thresholds for schedule delays, following a similar logic although the article focuses on cost, scope, and quality examples. |
| Scope Impact | Scope impact tiers quantify degradation from minor refinements at 0.03 to failure to achieve essential objectives at 0.60, reflecting escalating delivery risk. |
| Quality Impact | Quality impact levels range from subtle issues detectable only under detailed review at 0.03 to complete product failure at 0.60, where the outcome is unfit for purpose. |
| Agile Context | In Agile and Scrum environments, qualitative risk analysis is continuously embedded in sprint planning, backlog refinement, and daily standups, even when not formally labeled. |
The Place of Qualitative Risk Analysis in the Project Management Framework
In the PMBOK Guide, qualitative risk analysis belongs to the Planning Process Group and sits squarely within the Project Risk Management knowledge area. It follows the Identify Risks process and comes before Quantitative Risk Analysis and Plan Risk Responses. The entire purpose of Perform Qualitative Risk Analysis is to subjectively evaluate the characteristics of individual risks and then prioritize them based on their combined probability and impact, so that the team knows which handful of threats or opportunities deserve the most immediate attention. This is not a one-time event; it recurs throughout the project as new risks emerge and old ones shift in significance. In practice, many organizations collapse the distinction between qualitative and quantitative analysis, but the fundamental logic remains: you cannot meaningfully rank risks until you have agreed on what “high probability” or “severe impact” actually means for this specific project.
It is tempting to think that a generic five-level scale will work across all projects, and truthfully, some standard scales do provide a starting point. However, the quality, credibility, and eventual usefulness of the entire risk management process hinge on the definitions being tailored to the individual project’s objectives, tolerances, and stakeholder thresholds. The Plan Risk Management process is where that tailoring is supposed to occur, because the risk management plan itself should contain the probability and impact definitions that will be used during the subsequent qualitative analysis. When this tailoring is skipped, you end up with risk scores that look scientific but that consistently misclassify risks that matter to your particular context. A cost overrun of ten percent might be catastrophic on a fixed-price contract with thin margins, yet on a cost-plus research initiative it could be a mild inconvenience. The definitions must reflect such differences.
From a practical vantage point, many seasoned project managers treat the creation of these definitions as a negotiation with the sponsor and key stakeholders. What they are really negotiating is the project’s collective appetite for bad news. The very low probability threshold, for instance, marks the boundary below which the team will officially stop worrying about a risk. The very high impact threshold defines the point at which the project leadership accepts that a deliverable might no longer satisfy its essential objectives. Setting these lines too aggressively tight floods the risk register with high-priority items that the team cannot possibly manage, while setting them too loosely breeds complacency. Getting the calibration right demands both analytical clarity and a realistic understanding of the organizational culture.
In Agile and Scrum environments, the language of Perform Qualitative Risk Analysis is rarely used explicitly, but the underlying activity is embedded in sprint planning, backlog refinement, and daily standups. Teams constantly assess the probability that a blocker will arise and the impact it would have on the sprint goal. The difference is that the scales tend to be more fluid and emerge from conversation rather than from a documented risk management plan. Even so, the discipline of defining what “high” means remains valuable, especially for larger initiatives that must interface with traditional governance bodies. Whether you label the process formally or not, the cognitive step of agreeing on shared definitions cannot be bypassed.
Why Probability Definitions Must Come Before Risk Identification
One of the more counterintuitive lessons from the field is that the definitions should be finalized before the team brainstorms a long list of risks. If you wait until you are staring at a spreadsheet of fifty risks to decide how to score them, the temptation to back-fit the scales to produce the priorities you already believe in becomes overwhelming. By establishing the probability thresholds first, you create an impartial ruler that disciplines the subsequent assessment. This sequence mirrors the PMBOK’s logic: the risk management plan, which houses the definitions, is an output of Plan Risk Management, which happens before Identify Risks. The source material’s probability levels offer a template that a team can adapt, with values such as Very low at 0.03 and Very high at 0.60. Those numbers are not just labels; they embed an assumption that the most likely risks should never exceed a 60 percent chance of occurring, which in itself is a philosophical statement about how the organization views uncertainty.
The probability scale also needs to communicate a shared understanding of what a percentage really means. A risk with a probability of 0.15, described as Moderate, is not simply a number; it is a statement that the team expects this event to materialize roughly three times out of twenty similar projects. People notoriously misunderstand probabilities, often treating a 15 percent chance as either “rare” or “likely” depending on their personal experience. The verbal labels, Very low, Low, Moderate, High, and Very high, help bridge that gap, but only if the team collectively anchors those words to the numeric ranges. The table provided in the source material does exactly that, linking each label to a specific probability value. This approach prevents the all-too-common situation where one team member’s “Low” is another’s “Moderate,” which undermines the comparability of the risk scores.
Key Takeaways on Qualitative Risk Analysis
- Purpose of subjective risk prioritization
- Qualitative risk analysis uses expert judgment to evaluate individual risks, ranking them by combined probability and impact so the team can focus squarely on the most critical threats and opportunities.
- Recurring process throughout the project
- This analysis is repeated throughout the project to capture newly identified risks and reassess existing ones as their probability or impact shifts, keeping the risk profile both accurate and actionable.
- Project-tailored probability definitions
- The credibility of the entire risk management process depends on defining high probability and severe impact in terms that reflect the project's unique context, risk appetite, and potential consequences, rather than defaulting to generic scales.
- Stakeholder negotiation on thresholds
- Skilled project managers treat threshold setting as a deliberate negotiation with sponsors and stakeholders, recognizing that overly strict thresholds inflate the risk register with noise while excessively loose ones foster complacency and conceal genuine dangers.
Defining Risk Probability Levels for Qualitative Analysis
When you set out to define risk probability levels, you are essentially constructing a common language that turns uncertainty into a manageable classification system. The source material provides a five-tier probability scale: Very low at 0.03, Low at 0.07, Moderate at 0.15, High at 0.30, and Very high at 0.60. Notice the asymmetry built into these numbers. The gap between Very low and Low is relatively small in absolute terms, only 0.04, while the leap from High to Very high is twice that at 0.30. This nonlinear scaling reflects a real-world pattern: project risks rarely crowd in the middle; they either cluster at the low end where many small uncertainties reside or spike upward for the few truly menacing threats. A well-designed probability scale mirrors that distribution rather than forcing an artificial equidistant spacing.
It is easy to assume that these numeric values are intended to be precise statistical probabilities. In practice, they serve as anchor points for subjective judgment. No one can honestly claim that a particular risk has a 7 percent chance of occurring, down to the decimal. What the numbers do is force consistency across assessments. If two risk owners are asked to rate the probability of separate risks, the defined scale prevents one from calling a 1-in-3 chance “Low” while the other calls it “High.” The discipline of mapping fuzzy hunches onto a bounded scale is the real benefit, even if the underlying estimates are imprecise. Teams that skip this step and rely on unstructured adjectives invariably produce risk rankings that nobody trusts when the time comes to allocate contingency budgets.
An often-overlooked dimension of probability definition is the time horizon. A risk’s probability can only be meaningful when paired with a reference period. Does a “Very high” probability of 0.60 mean a 60 percent chance over the life of the entire project, or within the next phase, or during the current sprint? If the team does not answer this question, the same probability label will be applied to risks with vastly different exposure windows. A risk that might occur anytime in the next eighteen months carries a different urgency than one that is confined to a two-week iteration. Many risk management plans resolve this by specifying that all probabilities refer to the remaining duration of the project, but for long programs, a more granular approach may be needed.
Scaling probability for different project sizes also deserves attention. On a small project with a handful of discrete tasks, a 30 percent probability might translate into a fairly vivid expectation that the risk will fire. On a massive infrastructure program with thousands of moving parts, the same 30 percent can feel abstract and possibly understate cascading effects. The project manager’s role is to interpret the scale through the lens of the project’s complexity and to educate stakeholders about what the numbers practically mean. This is why the Plan Risk Management process insists on tailoring; no off-the-shelf scale can fit all contexts.
Linguistic Anchors as Decision-Making Shortcuts
Beyond the numbers, the five labels, Very low through Very high, function as cognitive heuristics that speed up risk triage in meetings. When a risk is labeled Very high probability, it signals to the team that this event is more likely to happen than not, and the entire posture shifts toward proactive mitigation. The source material’s choice to cap Very high at 0.60 rather than, say, 0.90, is instructive. It acknowledges that few project risks ever reach near-certainty, and that labeling something as practically guaranteed would trigger a different management response entirely, perhaps one better suited to an issue rather than a risk. This ceiling preserves a distinction between risk management and issue management, keeping the qualitative analysis focused on genuine uncertainties.
I’ve seen teams get tripped up by the Very low category, treating it as a dumping ground for risks they want to acknowledge but not actively manage. A probability of 0.03 might seem negligible, but on a project with hundreds of identified risks, several Very low probability events will, by simple combinatorics, occur. The definition must come with an explicit understanding that Very low does not mean “ignore.” It means “accept for now, but monitor.” The threshold below which no further action is taken should be a conscious management decision, not an accidental byproduct of a scale that looks safe because the numbers are small.
Defining Risk Impact Scales Across Multiple Dimensions
While probability gets much of the attention, defining risk impact scales is the part that forces a project team to articulate exactly what they value in a project. The source material breaks impact into four dimensions: Cost, Time, Scope, and Quality, and assigns five levels to each, from Very low to Very high. This multi-objective approach acknowledges that a risk can wreck the budget while leaving the schedule untouched, or can degrade quality in a way that stakeholders will not accept even if the delivery date holds. If the impact scale only measures cost overruns, scope-related risks become invisible until they have already mutated into cost problems later. A mature qualitative analysis uses all four dimensions, or a carefully chosen subset, to capture the full footprint of each risk.
For Cost, the definitions are anchored to percentage increases: a Very low impact is a trivial financial effect, numerically represented as 0.03; Low keeps the cost increase under 6 percent, with a numeric impact weight of 0.07; Moderate falls between 6 and 14 percent, at 0.15; High ranges from 14 to 28 percent, at 0.30; and Very high exceeds 28 percent, weighted at 0.60. These ranges connect directly to the thresholds that a project’s sponsor would use to approve additional funding or to escalate a concern. On a one-million-dollar project, a High impact could mean a cost blowout of $140,000 to $280,000, which is the sort of number that transforms a risk from a theoretical entry into a board-level discussion. The progressive widening of the percentage bands, from a 6-point spread at Low to a 14-point spread at High, mirrors how uncertainty compounds as impacts grow larger.
Time impacts follow a similar pattern but with different ranges that reflect the psychology of schedule pressure. Very low impact is a barely detectable shift, again weighted at 0.03. Low impact extends the timeline by less than 3 percent, at a weight of 0.07, which on a twelve-month project translates to about ten days of slippage. Moderate stretches the timeline by 3 to 7 percent, weighing 0.15; High lands between 7 and 15 percent, at 0.30; and Very high pushes beyond 15 percent, at 0.60. A Very high schedule impact on a two-year program means a delay of over three and a half months. For a product launch tied to a seasonal market window, that magnitude of delay can kill the business case entirely. The numeric weights, when aggregated across multiple risks, also feed into contingency reserve calculations, making the definitions operationally potent.
Scope and Quality impacts are more qualitative by nature, yet the source material still provides crisp anchors. For Scope, Very low means minor scope refinement with no functional impact, at 0.03; Low involves small scope elements adjusted but with the core intent preserved, at 0.07; Moderate sees several important scope components reduced, at 0.15; High scope reduction conflicts with stakeholder expectations, at 0.30; and Very high means the final deliverable no longer achieves essential objectives, at 0.60. Notice how the language shifts from internal technical adjustments at the lower levels to stakeholder perception at the higher levels. That shift is critical because scope impact is ultimately measured by the gap between what was promised and what is delivered.
Quality impact definitions trace a similar arc from technical nuance to outright failure. Very low quality dips are visible only under detailed review, at 0.03; Low quality issues become noticeable in specialized or high-precision uses, at 0.07; Moderate quality shortfalls require formal acceptance to continue, at 0.15; High quality shortfalls are rejected by primary stakeholders, at 0.30; and Very high quality failure prevents the product from fulfilling its purpose, at 0.60. The phrase “formal acceptance” at the Moderate level is a boundary that every quality manager will recognize. It marks the point where the team can no longer quietly fix things; they must surface the deficiency and negotiate whether the current state is acceptable. That boundary is a powerful risk escalation trigger.
Why Multi-Objective Impact Definitions Prevent Blind Spots
A risk that hits multiple dimensions simultaneously can have a compound effect that a single impact scale would miss. Imagine a risk that threatens to consume 20 percent of the contingency budget and also delay the project by 10 percent and also force the removal of a feature the marketing team has already promised to early adopters. If the risk register only tracks cost impact, this risk would be logged as High in cost and the team might reasonably decide it needs a mitigation plan. But what gets lost is the reputational damage from the scope reduction, which could have lasting consequences well beyond the current project. By defining impact scales for Cost, Time, Scope, and Quality separately and then combining them, either via a matrix or a simple highest-impact-wins rule, the qualitative analysis surfaces the true multidimensional nature of the threat.
This approach also forces a conversation about trade-offs that stakeholders often avoid until it is too late. When the team sits down to calibrate the impact scales, the sponsor might initially resist setting a concrete number for Very high cost impact because doing so feels like pre-authorizing a failure mode. But that resistance itself is valuable information. It signals that the organization may have a hidden assumption that cost overruns beyond a certain magnitude are simply unacceptable and will trigger project termination. Surfacing that assumption during planning allows the team to design risk responses that keep impacts below that threshold, rather than discovering the tripwire in the middle of execution when options have narrowed.
Key Insights on Impact Scaling
- Four impact dimensions defined
- Risk impact is assessed across Cost, Time, Scope, and Quality using five calibrated levels from Very Low to Very High, compelling teams to explicitly articulate their true priorities.
- Multi-dimensional risk visibility
- Measuring only cost overruns renders scope and quality risks invisible until they materialize as financial problems; mature analysis therefore captures the full impact footprint of each risk.
- Cost thresholds tied to percentages
- Cost impact levels are mapped to specific percentage increases, with weights from 0.03 for trivial effects up to 0.60 for cost overruns beyond 28 percent, aligned with sponsor escalation thresholds.
- Scope levels gauge stakeholder alignment
- Scope impact ranges from a minor refinement with no functional effect at 0.03 to a deliverable that no longer achieves its essential objectives at 0.60, with the High rating explicitly indicating a conflict with stakeholder expectations.
- Quality levels map to acceptance criteria
- Quality impact progresses from shortfalls visible only under detailed scrutiny at 0.03 to complete functional failure at 0.60, where High-level deficiencies are rejected outright by primary stakeholders.
Tailoring Probability and Impact Definitions to Your Project
The definitions provided in the source material are a starting point, not a universal prescription. Tailoring probability and impact definitions means converting these generic thresholds into numbers and descriptions that resonate with your project’s objectives, stakeholder tolerances, and contractual environment. A pharmaceutical R&D project navigating regulatory milestones, for example, might define Very high schedule impact as any delay that pushes the submission date past a statutory deadline, regardless of the percentage. A software development project operating under a SaaS subscription model might define Very high quality impact as any defect that causes a service-level agreement breach, even if the absolute number of affected users is small. The tailoring exercise is where project-specific boundary conditions meet the risk management plan.
The process of tailoring starts with gathering the project’s key performance indicators and the tolerance thresholds that the sponsor or customer has already approved, often buried in the project charter or business case. If the charter states that the project must not exceed a budget of $2 million, then any risk that threatens to push costs past $2 million is, by definition, a Very high cost impact, and the percentage scale should be calibrated so that the Very high threshold aligns with that absolute ceiling. If the charter is silent on tolerances, the project manager must facilitate a structured conversation to extract them, because without those guardrails, the risk definitions become an academic exercise. The numerical weights, 0.03, 0.07, 0.15, 0.30, and 0.60, can remain constant as a scoring mechanism even as the verbal anchors are rewritten, but the meaning of those weights must be communicated so that the team does not mistake a 0.15 Moderate for a trivial risk.
One effective tailoring technique is to draft the impact definitions for each objective twice: once as a threshold range using the language of the project’s primary metrics, and then again as a narrative scenario that a non-technical stakeholder would understand. A Moderate time impact might be formally defined as a delay between 5 and 8 weeks, but the narrative version might say, “We will miss the trade show pre-briefing window but still be able to present at the main event.” That kind of concrete illustration reduces the bickering that often erupts during risk review meetings when two people stare at a percentage and draw opposite conclusions. It also gives the risk owner a clear mental picture that guides more honest self-assessment.
Calibrating Probability Definitions for Recurring Versus One-Off Risks
A subtlety that many tailoring efforts miss is the distinction between risks that can occur multiple times during a project and those that can only happen once. A probability scale designed without that distinction will misprice risks that, if they materialize early, could recur later. For instance, a risk of key supplier delivery delays that can happen once per quarter might deserve a higher effective probability than a single-point calibration would suggest, because the project is exposed to it repeatedly. Some teams address this by defining probability in terms of the expected number of occurrences per time unit and then translating that into an overall project probability, but that introduces a layer of quantitative analysis that blurs the boundary with quantitative risk assessment. A more pragmatic solution is to keep the qualitative scale intact but flag repeatable risks and informally bump their probability by one level during the prioritization discussion. The formal definitions remain unchanged, but the team exercises judgment at the point of risk response planning.
The political dimension of tailoring cannot be ignored. Setting a Very high probability threshold at 0.60, as the source material does, might be perfectly rational for a construction project where weather delays are a known quantity. But what if the project sponsor insists that no risk should ever be labeled higher than Moderate probability because it would reflect poorly on the planning effort? This kind of pressure distorts the definitions from the outset. The project manager’s job is to push back by demonstrating that suppressed probability scores will only lead to under-resourced contingency plans and eventual blame when the inevitable High-probability risk fires. Transparency in the definitions becomes a shield against organizational optimism bias.
Common Pitfalls When Measuring Probability and Impact
Even well-intentioned teams fall into a set of predictable traps when they attempt to measure probability and impact for qualitative analysis. One of the most pervasive is the halo effect, where a risk that feels dramatic or has a compelling anecdote attached to it gets inflated probability and impact scores, while a technically severe but unsexy risk languishes with low ratings. The definitions themselves cannot eliminate cognitive bias, but they can reduce its influence by providing objective anchor points that force the assessor to justify why a risk belongs in the High bucket rather than the Moderate one. Without that constraint, the risk register becomes a reflection of the loudest voice in the room rather than a balanced portrait of project uncertainty.
Another frequent misstep is the conflation of impact severity with impact proximity. A risk that would cause catastrophic damage but only if a very improbable chain of events unfolds might be scored High simply because the assessor fixates on the vividness of the consequences. The probability and impact definitions are designed to be independent axes, yet human cognition bundles them together. Training risk owners to assess probability first, without looking at the impact scale, and then switch to impact, can partially mitigate this. The separate definitions in the source material, with distinct verbal anchors and numeric weights for each level, reinforce the independence of the two dimensions, but only if the facilitator actively enforces the separation during risk workshops.
Scale compression is a quieter but equally damaging pitfall. If the team’s risk culture is risk-averse, the entire register may end up clustered in the Moderate and High ranges, with nobody willing to assign a Low or Very low label for fear of being blamed later for downplaying a threat. The result is a flattened priority list where everything looks urgent and nothing gets the focused attention it deserves. The definitions can combat this by explicitly describing what a Low probability really feels like, using the source material’s 0.07 as a benchmark, and by coaching stakeholders that calling a risk Low is a sign of disciplined assessment, not negligence. Conversely, in overly optimistic cultures, the Very high end of the scale becomes a no-man’s-land that nobody visits, and the project is exposed to risks that should have been escalated.
When the Definitions Themselves Become the Problem
Sometimes the definitions are technically sound but practically unusable because they ask for a level of precision the team cannot supply. If the cost impact scale requires the assessor to know whether a risk will push the budget up by 13 percent or 15 percent, the assessment stalls in guesswork. In those situations, the definitions need to be broad enough that a reasonable person can confidently place the risk in a bucket without agonizing over borderline cases. The source material’s bands, like 6 to 14 percent for Moderate cost impact, provide a workable range, but on a project with high financial uncertainty, even those bands might be too tight. The project manager can decide to widen the ranges or to treat the numeric weights as ordinal rankings rather than cardinal measures, sacrificing some granularity for usability.
I’ve also encountered organizations that define impact exclusively in financial terms, ignoring time, scope, and quality, under the assumption that everything eventually converts to money. While it is true that a schedule delay can be monetized, the conversion is often contentious and delays the risk assessment. The risk owner might spend more time debating the cost of a day’s delay than actually managing the risk. By keeping time and cost as separate impact dimensions, you preserve the richness of the analysis and avoid paralyzing the process with debates over monetization formulas. The source material’s four-objective structure implicitly endorses that richness.
Key Insights on Measurement Pitfalls
- Halo effect skews scores
- The halo effect leads assessors to overrate risks that are vivid or anecdote-laden, inflating both probability and impact, while technically severe but less memorable threats are systematically undervalued.
- Anchors curb cognitive bias
- Well-defined, objective anchors compel assessors to justify precisely why a risk qualifies as High rather than Moderate, which reduces cognitive bias and strengthens the integrity of the risk register.
- Risk culture distorts distribution
- Overly cautious teams habitually cluster most risks in the Moderate to High bands to deflect blame, whereas excessively optimistic teams avoid the Very High category entirely, allowing genuine threats to remain unescalated.
- Facilitator enforces separation
- Distinct verbal anchors and numeric weights for probability and impact preserve the independence of these dimensions only when the facilitator actively enforces the separation during workshops, preventing assessors from conflating the two.
Connecting Probability and Impact to the Risk Matrix and Response Planning
Once the definitions are in place, probability and impact combine in a risk matrix to produce risk scores and priority levels, typically expressed as green, yellow, or red zones. The matrix is the visible output, but its entire meaning derives from the definitions that feed into it. If the Very high impact threshold is set too low, the red zone swells and the matrix loses its ability to discriminate among the truly critical items. The numeric weights from the source material, such as 0.30 for High and 0.60 for Very high in both probability and impact, can be multiplied together to yield a risk score, but the multiplication itself is an act of quantification that steps slightly past pure qualitative analysis. Many organizations stay squarely in the qualitative realm by using a lookup table that maps probability-impact combinations to risk levels without multiplying, preserving the ordinal nature of the scales.
The definitions also directly govern how contingency reserves are sized. When the risk management plan states that risks with a Very high or High combined score will be candidates for active mitigation, the cost and time estimates tied to those risks draw from management reserves or contingency budgets. If the definitions are sloppy, the reserve request will be either inflated or dangerously lean. The transition from qualitative analysis to quantitative risk analysis, when it occurs, relies on the same definitions to ensure that the modeled probability distributions align with the team’s stated risk perceptions. A disconnect at this interface is a common source of credibility problems between the project manager and the finance or PMO functions.
Risk response planning also feels the influence of the definitions in a subtle but pervasive way. A risk that falls just below the threshold for active response will be assigned a “watch and wait” strategy, which in practice often means it receives no formal monitoring at all. If the definitional boundary between Low and Moderate is off by a small margin, a whole cluster of risks may drift into the neglected zone. The project manager who understands this will periodically stress-test the boundaries by asking, “If a risk at this threshold actually occurred, would we regret not having a plan?” and adjusting the definitions or the response trigger accordingly.
How the Definitions Shape Stakeholder Communication
When the project manager reports risk status to a steering committee, the probability and impact definitions provide the codebook that translates detailed risk data into executive summaries. A statement like “three risks are currently rated High in both probability and time impact” only carries weight if the committee knows that High time impact means a delay of 7 to 15 percent of the project duration. Without that shared understanding, the report is just colorful charts. The definitions thus double as a communication device, and their clarity directly affects the quality of governance decisions. Investing time in socializing the definitions with the sponsor and key stakeholders early in the project pays dividends when tough conversations about risk escalation arise later.
Practical Application of the Example Scales in Real Projects
Let’s step through how the provided scales might play out in a typical mid-sized technology implementation, without claiming this as a specific case study but rather as a thought experiment grounded in the numbers from the source material. Suppose the project has a budget of $800,000 and a timeline of ten months. Using the cost impact definitions, a Low impact risk would cause a cost increase of less than 6 percent, or under $48,000, with a weight of 0.07. A High impact risk would land the project in a cost overrun of $112,000 to $224,000, weighted at 0.30. These figures give the project manager a concrete vocabulary when discussing potential supplier price hikes or scope creep. On the time side, a Moderate impact risk adding 3 to 7 percent to the timeline, with a 0.15 weight, translates to a delay of roughly two to four weeks, which in a ten-month project might slide the delivery past a seasonal customer readiness window.
The scope and quality dimensions come alive when the product has a public launch commitment. A Moderate scope reduction, at 0.15, would cut several important components, forcing the product manager to renegotiate expectations with early adopters. A High quality shortfall, at 0.30, would mean the primary stakeholders formally reject the deliverable, potentially triggering a cycle of rework that itself becomes a secondary risk. These thresholds are not just theoretical; they map to the escalation paths defined in the project’s governance framework. The very act of writing them into the risk management plan creates the hooks that the change control process will later use to justify rebaselining.
What makes these scales particularly useful is that they work across different project types without requiring deep customization. A Very high probability of 0.60 feels substantial whether you are managing a construction project, a software release, or an organizational change initiative. The impact percentages can be reinterpreted in any domain where cost, time, scope, and quality are meaningful. That said, some contexts demand additional impact dimensions, such as regulatory compliance, safety, or reputation. In those cases, the project manager can extend the framework by defining new impact scales that follow the same five-level structure with parallel weights, ensuring that the risk matrix remains consistent. The source material’s approach is extensible, not rigid.
Applying Example Scales to Projects
- Quantified cost impact
- Applied to an $800,000 budget, the scale converts risk levels into actionable financial estimates: a Low risk weighted at 0.07 adds less than $48,000, while a High risk at 0.30 incurs $112,000 to $224,000, enabling precise contingency allocation and trade-off analysis.
- Schedule and scope implications
- For a ten-month project, a Moderate time impact of 3 to 7 percent with a weight of 0.15 results in a two- to four-week delay that can cascade into milestone resets. A Moderate scope reduction compels the product manager to renegotiate commitments with early adopters, threatening initial market alignment and trust.
- Extensible framework design
- Embedding the scales into the risk management plan anchors change control rebaselining and ensures traceability. Additional impact dimensions can be appended using the same five-level structure with harmonized weights, preserving the consistency and comparability of the overall risk matrix.
BVOPM and Alternative Approaches to Defining Risk Impact
The Business Value-Oriented Project Management (BVOPM) framework adds a distinctive lens to the way risk probability and impact are defined, particularly through its concept of separate product risk management. In BVOPM, impact is not always expressed as a percentage deviation from a plan but as a quantified “Loss size” unit, which can be monetary, but also encompasses value erosion in terms of customer satisfaction or future business opportunity. This approach pushes the definitional exercise beyond the traditional triple constraints and forces a conversation about what the organization truly stands to lose if a risk materializes. For projects where the primary output is a product, BVOPM’s dynamic filtering of risks based on business value impact can supplement the classic probability-impact grid by highlighting risks that threaten the value proposition even when the schedule and budget remain untouched.
Under BVOPM, the risk definitions are also expected to be transparent to a cross-functional team that includes business stakeholders, not just technical leads. This aligns with the principle that risk definition is a shared management responsibility, not a back-office exercise. The source material’s multi-objective impact scales would fit comfortably within a BVOPM environment, provided that the organization additionally defines a Business Value impact dimension. A risk that degrades quality to the Moderate level, requiring formal acceptance to continue, could, in BVOPM terms, be tagged with a specific Loss size that reflects the projected drop in user adoption or net promoter score. The added rigor does not replace the qualitative analysis but enriches it, making the risk register a more complete reflection of stakeholder concerns.
Even organizations that do not formally adopt BVOPM can borrow its emphasis on making risk definitions operationally testable. If a definition states that a Very high quality failure prevents the product from fulfilling its purpose, the team should be able to point to the specific product requirement that would be violated, and to the customer segment that would walk away. BVOPM’s insistence on predefined root-cause categories for defect analysis also echoes the need to link impact definitions to the underlying drivers of risk, so that response plans address causes rather than just symptoms. This is a natural extension of the thinking behind the source material’s scales, even if the terminology differs.
Sustaining the Definitions Across the Project Lifecycle
The probability and impact definitions are not a one-time deliverable of the planning phase; they must be revisited as the project’s context evolves. A risk that was rated Low probability during initiation may become High probability by the time execution is halfway complete, because assumptions have changed or because early warning indicators have fired. If the definitions themselves are left untouched, they can become an obstacle to honest reassessment. For example, if the cost impact scale was calibrated when the budget had a generous contingency, a later budget cut should trigger a tightening of the thresholds so that risks are not artificially rated lower than they now deserve. The PMBOK process of Monitor Risks includes the evaluation of the risk management plan’s continued suitability, which encompasses the definitions.
A practical rhythm is to review the definitions at each phase gate or major milestone, comparing them against actual realized risks and issues. If a risk that was rated Very low probability actually materialized, that is a signal to examine whether the probability scale is understating likelihoods across the board, or whether that risk was simply an outlier. Similarly, if an impact that was forecasted as Low ended up consuming significantly more resources than the 6 percent threshold would have predicted, the impact scales may need recalibration. This feedback loop closes the gap between planned definitions and operational reality, and it is one of the most neglected practices in project risk management. Teams that commit to it find that their qualitative risk analyses become progressively more accurate and trusted over the life of the program.
Surprisingly, the qualitative nature of the process does not excuse it from being refreshed when the project environment shifts to a more Agile delivery model mid-stream. If the organization decides to move from a waterfall release to a series of incremental deployments, the time impact scale that was built around a single end date may become misleading. The team might need to redefine time impact in terms of sprint-level delays, while keeping the overall project impact as a parallel measure. The definitions can remain rooted in the same five-level structure, but the narrative anchors shift. The discipline of maintaining definitional integrity, even as methodology changes, is what distinguishes mature risk management from a one-off paperwork exercise.
The Subtle Art of Keeping Definitions Alive
One of the quietest risks in the whole enterprise is that the definitions fade from memory after they are signed off. Team members join and leave, and the new arrivals inherit a risk register but not the context of what the thresholds mean. Without deliberate onboarding around the definitions, the quality of risk assessment erodes. Smart project managers include the probability and impact definitions in a simple one-pager that is distributed at every project kickoff meeting and referenced during risk review workshops. This mundane practice, repeated consistently, does more for the credibility of qualitative risk analysis than any sophisticated tool or technique.
Core Takeaways on Keeping Risk Scales Current
- Definitions demand ongoing review
- Revisiting probability and impact definitions throughout the project is essential because evolving assumptions and early warning indicators can shift a risk’s actual likelihood and severity.
- Triggers for threshold recalibration
- A significant budget reduction or similar contextual change should immediately tighten impact thresholds so that risks are not artificially understated.
- Phase gates as a review cadence
- Evaluating definitions at each major milestone against actual realized risks and issues reveals when probability scales understate true likelihood or impact thresholds are excessively lenient.
- Adapting to delivery model shifts
- Shifting to an Agile delivery model mid-stream requires refreshing time impact scales, because scales built around a single end date become misleading when deployments are incremental.
