Decision Tree Analysis is a structured decision-support technique used in project management to evaluate choices under uncertainty by modeling sequential decisions, chance events, and potential outcomes in a branching diagram. It combines probabilities with monetary values or other measurable payoffs, allowing project teams to compare alternatives and select the path with the highest expected value or a risk-adjusted preference. In project, program, and portfolio management, the technique appears most often during quantitative risk analysis and business case development, but its logic also supports change evaluation, make-or-buy analysis, and stage gate reviews.
The term can sound mathematical, but the underlying idea is straightforward. A project manager rarely faces a single decision with a guaranteed result. More often, one choice leads to an uncertain condition, which then creates another decision or outcome. Decision Tree Analysis makes those layers explicit so the team can see not only the immediate cost but also the downstream implications of each branch.
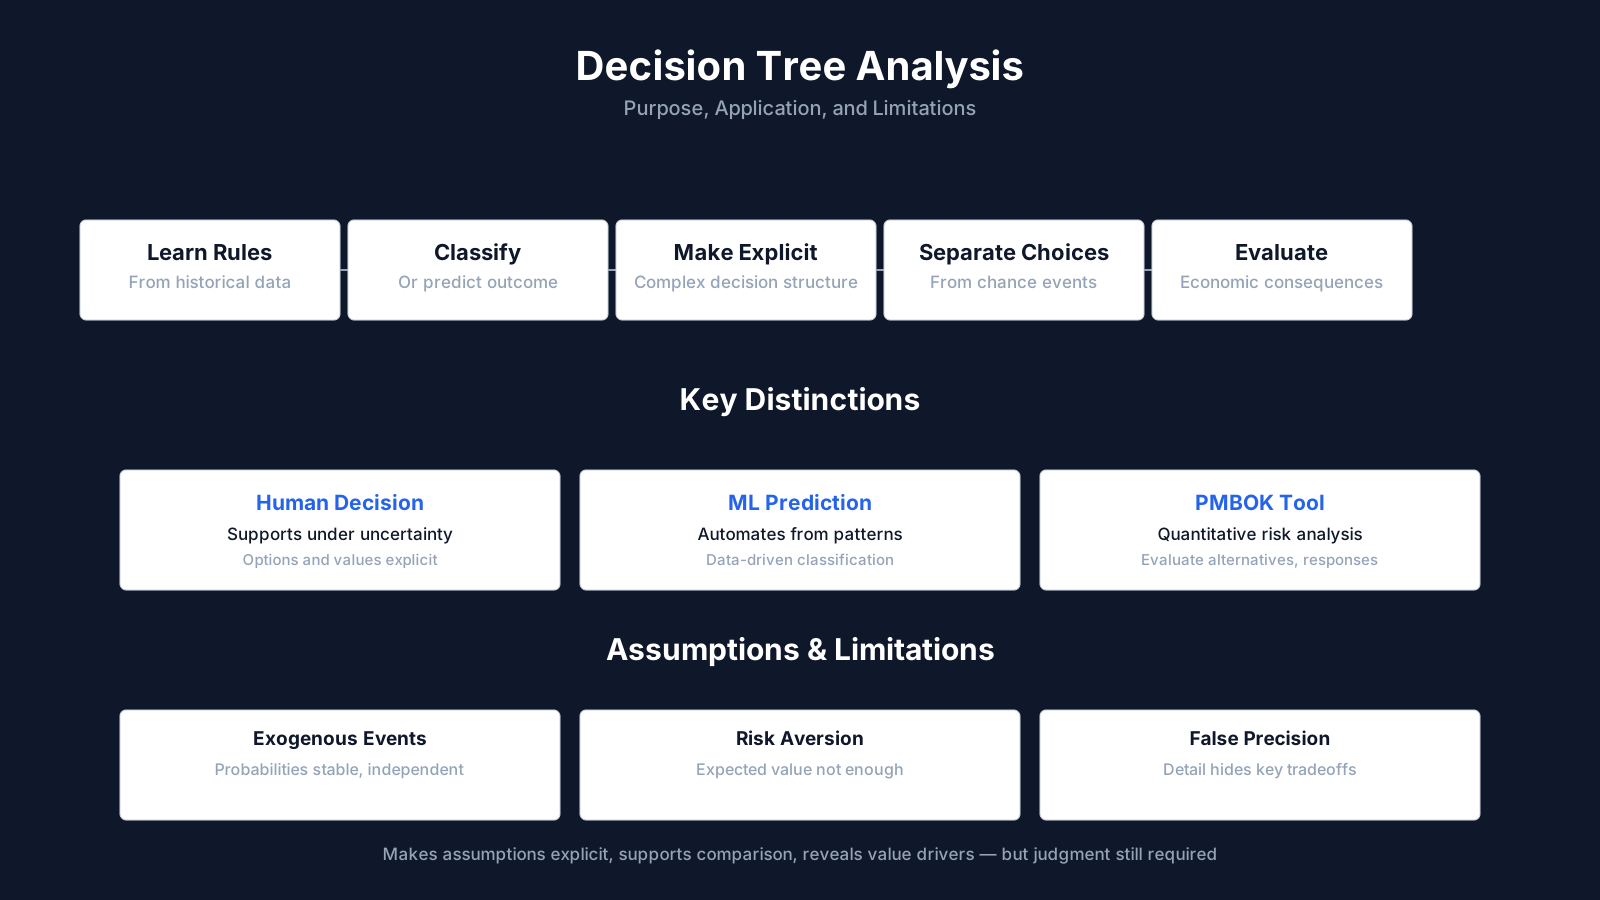
Decision Tree Analysis: Summary of Key Topics
| Key Concept | Summary |
|---|---|
| Definition | Decision Tree Analysis is a structured decision support technique that decomposes complex, uncertain choices into a sequence of decision points, chance events, and measurable outcomes. |
| Components | A typical tree comprises a root decision node, branches representing alternative courses of action, chance nodes capturing uncertain conditions, and terminal nodes quantifying the value of each possible end state. |
| Probability & Payoff | By weighting each branch outcome by its probability and monetary or otherwise comparable payoff, the analysis isolates the path with the greatest expected value and clarifies downstream risk exposure. |
| Project Management Use | Project teams use the technique to evaluate build versus buy decisions, compare risk acceptance against risk transfer, and prioritize competing scope options under constrained resources. |
| Applications | The method is a core tool for quantitative risk analysis and business case development, while also supporting change impact evaluation, make-or-buy analysis, and stage gate investment reviews. |
| History | Its adoption across engineering, finance, and operations demonstrates that Decision Tree Analysis is a general decision discipline adapted to project constraints, not a standalone project management artifact. |
| Limitation | Results become unreliable when the tree is built with weak probability estimates or omits material cost categories, producing an overly precise but misleading recommendation. |
What Is Decision Tree Analysis?
The Decision Tree Analysis definition refers to a quantitative risk analysis and decision modeling method in which a decision is represented as a root node, branches show available choices, chance nodes capture uncertain conditions, and terminal nodes record the value of each end state. The model is read from left to right, beginning with a square decision node. From there, lines branch out to represent alternatives. Circles represent chance events with assigned probabilities, and terminal bars or triangles show outcomes.
Project teams usually assign each outcome a monetary value or another measurable unit, then calculate back from right to left to compare branches. That backward calculation is sometimes called folding back, and it produces an expected value for each earlier decision point. The structure forces the team to separate what it controls from what remains uncertain.
Decision Tree Analysis Definition
Decision Tree Analysis is formally defined as a technique for making decisions under uncertainty by decomposing a complex choice into a sequence of simpler choices and uncertain events. Each path through the tree represents a possible sequence of decisions and chance outcomes. The value at the end of a path is multiplied by the probabilities along that path, and the results are aggregated for comparison.
A practical way to think about it is a what-if map. Instead of debating the whole decision at once, the team asks what happens if it chooses one option, then what might occur next, and what that outcome would cost or earn. The visual form encourages more complete thinking than a single financial estimate.
Decision Tree Analysis in Project Management
In a project management context, Decision Tree Analysis is used to evaluate choices such as whether to build or buy a component, accept or transfer a risk, or pursue one scope option over another. The technique appears in quantitative risk analysis and in business case evaluation. It is particularly useful when a decision has several possible outcomes that can be expressed in monetary terms and when some information about probabilities exists.
The project manager and sponsor often want a defensible, transparent basis for a decision. A decision tree provides a visual record of the alternatives, assumptions, and expected values, which is valuable when stakeholders challenge the recommendation. It shifts the conversation from opinion to a shared model of conditional consequences.
Origins and Cross-Industry Context
Decision tree methods emerged from operations research and decision theory, not from project management standards. Their use in business, medicine, engineering, and finance long predates their inclusion in project management guides. In medicine, decision trees support diagnostic and treatment pathways. In engineering, they guide reliability and safety decisions.
In finance, the same branching logic underlies simplified option valuation and capital allocation under uncertainty. Project management borrows the technique for situations where the decision and the risk are intertwined. The cross-industry history matters because it shows that the technique is not a narrow project management artifact but a general decision discipline adapted to project constraints.
Key Insights on Decision Tree Analysis
- Tree structure and symbols
- A decision tree is composed of square decision nodes, branches that represent available choices, circles for chance events with assigned probabilities, and terminal bars or triangles that capture final outcome values.
- Folding back for expected value
- Teams assign monetary or measurable values to each outcome, then work backward from right to left by multiplying probabilities along each path to compare expected values at every decision point.
- Project management applications
- Decision tree analysis enables project teams to evaluate options such as build versus buy, risk acceptance versus transfer, and alternative scope decisions while producing a visual record of assumptions and expected values that supports clear stakeholder review.
Key Components of Decision Tree Analysis
The key components of Decision Tree Analysis include decision nodes, chance nodes, branches, probabilities, payoffs, and the expected value calculation used to fold the tree back. Each component has a distinct role, and confusion among them leads to poor models. The visual grammar is simple, but it carries precise analytical meaning.
A tree that looks complete but lacks credible probabilities or omits major cost categories can produce a dangerously clean result. For that reason, experienced practitioners treat component definition as the first quality check. The model is only as useful as the elements feeding into it.
Decision Nodes, Chance Nodes, and Terminal Nodes
A decision node is usually drawn as a square and marks a point where the project manager or sponsor selects among alternatives. A chance node is drawn as a circle and represents an uncertain event outside the team's direct control, such as market demand, supplier performance, or regulatory approval. A terminal node shows the final value or result of a particular path.
Branches connect the nodes. Decision branches show choices; chance branches show possible outcomes. Each chance branch carries a probability. Each terminal node carries a payoff, cost, or other value measure. This visual grammar is not decorative. It forces the team to distinguish choices from uncertainties, which is one of the most valuable mental disciplines in project risk management.
Probabilities, Payoffs, and Expected Monetary Value
Each uncertain event in a decision tree is assigned a probability, expressed as a percentage or decimal. The probabilities on branches from a single chance node should sum to one. Payoffs are typically expressed in monetary units, though health, safety, schedule time, or business value points can also be used if converted into a comparable scale.
Expected monetary value, or EMV, is calculated for each branch by multiplying the outcome value by its probability and then summing the results along a path. The branch with the highest EMV is usually considered the economically preferred choice, assuming the decision maker is risk neutral. If the organization is strongly risk averse, a utility function may replace the raw monetary value.
The practical takeaway is that the team is not simply selecting the branch with the best best-case result. It is selecting the branch that produces the best average result when all realistic outcomes are weighted by their likelihood. A choice with a huge upside but a tiny chance may have a lower EMV than a modestly positive but reliable choice.
Types and Variations of Decision Trees
Decision trees can be deterministic or probabilistic. A deterministic tree contains no chance nodes and simply lays out conditional consequences. A probabilistic tree includes chance nodes and expected values. In project management, the probabilistic form is more common because risk and uncertainty are central to nearly every significant project decision.
There are also hybrid forms in which some payoffs are calculated as net present values, others as schedule days, and still others as qualitative scores. These require careful scaling and are sometimes converted into utility values. Utility-based trees adjust payoffs for the organization's risk attitude, whereas EMV trees assume risk neutrality.
Decision Tree Analysis in PMBOK and PRINCE2
When discussing Decision Tree Analysis in PMBOK, practitioners typically refer to the Perform Quantitative Risk Analysis process within Project Risk Management. The technique supports expected monetary value calculations and comparison of alternative risk responses. It appears alongside simulation and sensitivity analysis as a forward-looking quantification tool.
PRINCE2 does not use the same process-based language, but the method fits comfortably within its risk management and business case themes. Both frameworks accept decision trees as a valid analytical technique, though neither treats them as mandatory for every project.
Decision Tree Analysis in PMBOK
PMBOK's Perform Quantitative Risk Analysis process uses decision tree analysis to model decisions and uncertain events together. This makes the technique distinct from tools that only rank risks or only simulate schedule or cost outcomes. It fits primarily in the Planning Process Group, but a project team may revisit it in Monitoring and Controlling when new information changes assumptions or risk exposure.
Within the PMBOK ecosystem, decision tree analysis is linked to the risk register, the risk management plan, and the quantitative risk analysis outputs. It helps prioritize risk responses because it shows which decision branches carry the greatest value at stake. The results can inform the risk response plan and contingency reserves.
Decision Tree Analysis in PRINCE2
PRINCE2 does not prescribe decision tree analysis as a named technique, but its principles and themes allow the method to be used whenever decisions must be made under uncertainty. The business case theme requires explicit analysis of costs, benefits, and risks. A decision tree can support option appraisal when comparing different ways to achieve project objectives.
In PRINCE2, the management of risk procedure encourages project managers to identify and evaluate risks, then plan responses. Decision tree analysis can add quantitative depth to that evaluation, especially when a decision has multiple stages and the choice of one response depends on how an earlier risk unfolds. This aligns with PRINCE2's emphasis on continuing business justification.
Decision Tree Analysis in Agile and Hybrid Projects
Agile environments often favor short feedback loops and empirical learning over extensive predictive modeling. A Scrum team is unlikely to draw a decision tree during a sprint planning session. However, at the product planning, release, or portfolio level, decision trees can still support choices about product direction, technical architecture, or investment timing where uncertainty is material and data is available.
In hybrid projects, decision tree analysis often sits at governance gateways. A team may use Agile delivery within a stage but apply a decision tree at the stage boundary to evaluate whether to continue, pivot, or stop. This preserves the speed of Agile execution while giving sponsors a clear risk-adjusted rationale for major commitments.
BVOP Perspective on Decision Tree Analysis
Business Value-Oriented Project Management emphasizes product risk management, value delivery, and waste reduction. Its product risk approach uses quantified loss size and dynamic filtering. Decision tree analysis can support that quantification when a product risk has multiple possible loss outcomes and probabilities that can be estimated.
BVOP also treats excessive process and rejected acceptable work as waste. A decision tree can make the cost of overwork or rework visible across branches, but BVOP practitioners would not rely solely on the tree if it creates heavy process overhead. The technique is meaningful when the decision is complex enough to justify the modeling effort.
Key Insights on Decision Tree Use
- PMBOK quantitative risk analysis
- In PMBOK, decision tree analysis functions as a technique within the Perform Quantitative Risk Analysis process, underpinning expected monetary value calculations and enabling structured comparison of alternative risk responses.
- PRINCE2 risk and business themes
- PRINCE2 uses different terminology but positions decision trees within its risk management and business case themes, and both frameworks treat the technique as an optional rather than mandatory practice.
- Planning and monitoring fit
- The technique is primarily associated with the Planning Process Group, though it can be revisited during Monitoring and Controlling when new information shifts underlying assumptions or changes risk exposure.
- Agile portfolio-level applications
- In Agile environments, decision trees are applied at product planning, release, and portfolio levels to inform product direction, technical architecture, and investment timing decisions when uncertainty has significant consequences.
Purpose and Importance of Decision Tree Analysis
The purpose of Decision Tree Analysis is to make uncertainty explicit and to compare project alternatives using a consistent, quantified logic rather than intuition alone. It helps stakeholders see the conditional chain of choices and consequences. That visibility is especially important when decisions involve large sums, long time horizons, or irreversible commitments.
In many project environments, the alternative to a decision tree is not perfect judgment. It is often a mixture of strong opinions, selective attention to favorable outcomes, and hidden assumptions. The tree does not eliminate bias, but it makes the reasoning available for inspection and challenge.
Role in Project Selection and Risk Response Planning
Organizations use decision tree analysis in project selection when the future benefits of a project depend on uncertain conditions such as market adoption, commodity prices, or regulatory outcomes. By modeling these conditions, a portfolio committee can compare projects not only by their best-case returns but by their probability-weighted results.
During risk response planning, a decision tree can help choose between mitigation, transfer, avoidance, or acceptance. For example, the cost of insurance or redundancy can be compared with the expected loss if the risk occurs. The technique is particularly useful when one risk response creates another decision later.
Decision Quality and Transparency
A major benefit is not just the numerical result. Decision tree analysis creates a visual record of assumptions, probabilities, and trade-offs. When a sponsor asks why a recommendation was made, the project manager can point to the logic embedded in the branches rather than simply stating a preference.
This transparency also exposes bad reasoning. If a probability estimate is biased or a payoff omits a major cost, the tree makes the gap easier to detect. In that sense, the process of building the model is often more valuable than the final expected value.
Practical Application of Decision Tree Analysis
In practice, Decision Tree Analysis in project management is used by project managers, risk managers, sponsors, PMO analysts, and portfolio committees to evaluate decisions that have financial consequences and uncertain branches. The technique is most common during planning and at governance gates, rather than as a continuous control tool.
It tends to show up when the cost of being wrong is high and when the decision cannot easily be reversed. Small daily choices do not need a decision tree. Major contracting, scope, and investment choices sometimes do.
Who Uses Decision Tree Analysis and When
Project managers use it when planning significant procurements, evaluating alternative delivery strategies, or deciding whether to build a component in-house. Risk managers may include it in quantitative risk analysis for high-stakes risks. Sponsors and portfolio committees use decision trees at stage gates to decide whether continued funding is still justified. PMO analysts often build the model and challenge the assumptions.
It is applied most often during planning and at decision gates, but not as a continuous control tool. A project team may develop a decision tree once, then update it if probabilities or costs change materially. It is less common in routine operational decisions or daily task planning.
Common Scenarios in Projects
A classic scenario is a make-or-buy decision. The project can purchase a component at a known price, or it can develop it internally at a lower unit cost but with a chance of technical failure or delay. The decision tree separates the purchase branch from the development branch, then models success or failure under the latter.
Another scenario is contracting. A fixed-price contract may cost more upfront but transfer cost risk to the seller. A time-and-materials contract may be cheaper if work remains stable but exposes the buyer to cost overruns if requirements change. A decision tree can compare the expected costs of these contract types under different change likelihoods.
Change request evaluation can also use a small decision tree. If a requested change is accepted, it may accelerate benefits but also increase technical complexity. If rejected, the project may avoid risk but lose an opportunity. The tree helps the change control board see the conditional impacts.
Consider a project that must choose between leasing specialized equipment or purchasing it. Leasing involves lower initial cash but higher operating cost if use extends well beyond the current phase. Purchasing involves higher initial cash but lower long-run cost. The tree branches the two choices, then branches possible duration of use, with probabilities. The resulting expected costs give a clear comparison despite the uncertain duration.
Core Insights on Users and Timing
- Primary users of decision trees
- Project managers, risk managers, sponsors, PMO analysts, and portfolio committees rely on decision tree analysis for choices that combine material financial impact with multiple uncertain paths.
- Planning and governance gates
- Decision tree analysis is most frequently applied during planning and at governance gates, rather than as an ongoing control mechanism for continuous project monitoring.
- High cost of being wrong
- Decision trees are reserved for high-stakes decisions where errors carry significant cost and are difficult to reverse, whereas routine daily choices do not justify this level of analytical rigor.
- Project manager applications
- Project managers apply decision trees when structuring major procurements, evaluating competing delivery strategies, or assessing whether to build a component in-house or source it externally.
- Stage-gate funding reviews
- Sponsors and portfolio committees use decision trees at stage-gate reviews to determine whether continued funding remains justified, refreshing the model whenever underlying probabilities or cost assumptions shift materially.
Common Challenges and Misconceptions in Decision Tree Analysis
The most common challenges of Decision Tree Analysis involve unreliable probability estimates, false precision, and the assumption that the highest expected monetary value is always the right choice. These issues can quietly undermine the credibility of an otherwise well-structured model. Recognizing them is part of using the technique responsibly.
Sometimes the challenge is not mathematical but political. A tree may expose that a favored project has a poor expected value, and the sponsor may push back on the assumptions rather than the result. That does not make the technique wrong, but it means the practitioner must be prepared to facilitate rather than simply present.
Estimation Pitfalls and False Precision
Probabilities assigned to chance nodes often come from expert judgment. That is not inherently wrong, but it can create overconfidence. A tree that shows a 62 percent chance of vendor success may look rigorous, but if the estimate was based on a single optimistic opinion, the precision is misleading. Teams should test whether the conclusion changes if probabilities move by five or ten percentage points.
Payoffs can also be deceptive. A branch may include direct cost and revenue, but omit maintenance, training, disruption, brand damage, or opportunity cost. The model then produces an answer that is mathematically correct within its assumptions but incomplete in practical terms.
When Not to Use Decision Tree Analysis
Decision tree analysis is not well suited for very simple decisions where the cost of modeling exceeds the value at stake. It is also less useful when probabilities cannot be estimated with any confidence, or when the decision involves deeply qualitative values that resist monetary conversion. In high-velocity Agile settings, a formal tree may slow down a choice that a team could resolve with a quick experiment.
The technique can become unwieldy when a project has many interacting risks. Each new chance node multiplies the number of possible paths. A tree with twenty branches may be readable; one with hundreds becomes a documentation exercise rather than a decision aid. In those cases, influence diagrams or Monte Carlo simulation may be more appropriate.
Misunderstandings About the Technique
A common misunderstanding is that decision tree analysis predicts the future. It does not. It models assumptions about possible futures and their values. The quality of the output depends entirely on the quality of those assumptions. Another misconception is that the tree forces a mechanical choice. In reality, the project manager can select a lower-EMV option if it aligns better with risk tolerance, strategic fit, or nonfinancial objectives.
Some also confuse decision tree analysis with a decision table or with machine learning classification trees. A decision table lists rules and outcomes in tabular form; a project decision tree shows sequential decisions under uncertainty. Machine learning trees classify data, whereas project decision trees evaluate alternatives. They share a visual metaphor, not the same purpose.
Decision Tree Analysis vs Related Tools and Techniques
A frequent comparison is Decision Tree Analysis vs Expected Monetary Value, where expected monetary value is a component of the decision tree rather than a separate competing technique. The tree supplies the structure and the conditional sequence; EMV supplies the arithmetic inside that structure. Understanding the difference prevents both terms from being used interchangeably in risk conversations.
The broader ecosystem includes influence diagrams, Monte Carlo simulation, scenario analysis, and real options. Each tool has a different strength, and experienced practitioners often use several together. Confusing them can lead to a mismatch between the question being asked and the tool selected.
Decision Tree Analysis vs Expected Monetary Value
Expected monetary value is an arithmetic result that can be used in many risk techniques, including decision trees. A decision tree uses EMV to compare branches, but it also provides the structure, the visual sequence, and the explicit modeling of later decisions. EMV alone does not show the conditional path or the timing of choices; the tree does.
A risk register might include an EMV for each risk, but it does not show how choosing response A leads to a second decision if the risk occurs. The decision tree makes that dependency visible, which is why it is preferred for multi-stage decisions.
Decision Tree Analysis vs Influence Diagrams and Monte Carlo Simulation
Influence diagrams are compact diagrams that show decisions, uncertainties, and objectives as nodes with arrows showing influence. They are useful for high-level mapping but do not lay out every branch and outcome in detail. A decision tree is more explicit and more suitable for calculation, while an influence diagram is better for clarifying relationships before modeling.
Monte Carlo simulation samples thousands of possible outcomes based on probability distributions and produces a range of results. It is stronger when there are many interacting variables and continuous uncertainty. A decision tree works best with discrete alternatives and a clear sequence. Practitioners sometimes combine the two by using Monte Carlo simulation to generate probability distributions that feed into tree branches.
Decision Tree Analysis vs Scenario Analysis and Real Options
Scenario analysis examines selected plausible futures without necessarily assigning exact probabilities or sequential decisions. Decision tree analysis assigns probabilities and calculates expected values. Real options thinking treats flexibility as valuable, similar to financial options. Dedicated real options valuation can be more useful when project stages can be abandoned, expanded, or delayed, but a decision tree can capture that flexibility in simplified form.
Key Insights on Decision Tree Comparisons
- EMV supplies the arithmetic within
- Expected monetary value is not a competing alternative to decision trees; it is the arithmetic engine that quantifies and compares each branch inside the tree's structural and conditional sequence.
- Distinct tools, complementary strengths
- Decision trees offer a transparent, calculation-ready structure, influence diagrams clarify dependencies before detailed modeling begins, and Monte Carlo simulation samples thousands of outcomes to reveal the full distribution of results; practitioners therefore frequently use all three together.
- Scenario analysis and real options
- Scenario analysis examines plausible future states without requiring precise probabilities or sequential decision logic, while real options valuation captures the value of managerial flexibility such as abandonment, expansion, or deferral; a decision tree can represent these same choices in a simplified but structured form.
Evolution and Current Thinking on Decision Tree Analysis
The evolution of Decision Tree Analysis in project management reflects a shift from rigid expected value calculations toward broader decision quality practices that include uncertainty, risk appetite, and nonfinancial objectives. Early use often focused on the arithmetic. The tree was drawn, EMV was calculated, and the highest EMV branch was accepted.
Over time, practitioners recognized that the result is only as good as the framing, the probability judgments, and the treatment of nonmonetary values. That recognition changed how the technique is taught and applied in real project environments.
From Decision Theory to Project Risk Management
Decision tree methods grew out of decision theory and operational research in the mid twentieth century. Business schools and engineering programs adopted them early because they made decisions transparent and teachable. The project management profession later adapted the technique as quantitative risk analysis matured, and PMBOK included it as one of several techniques for modeling risks and decisions.
The original appeal was clarity. A complex decision could be drawn on a single page, and the alternatives could be compared with a consistent numerical logic. The limitation, which became clearer over decades, was that the numbers could easily harden into a false sense of certainty.
Current Best Practices and Debates
Current best practice treats decision tree analysis as a thinking discipline rather than a forecasting machine. Facilitators use structured elicitation to reduce bias in probability estimates. They test the sensitivity of the decision to key inputs and document the rationale behind each branch. This approach is sometimes called decision quality.
There is also debate over whether to maximize EMV or to use utility functions that adjust for risk aversion. Many organizations tolerate a lower EMV if it reduces downside exposure. Others argue that utility functions are difficult to elicit consistently and that simple risk thresholds are more practical.
The rise of data analytics and machine learning has created some terminology confusion. Software that generates classification trees for predictive models is not the same as decision tree analysis for project decisions. But the visual similarity means that practitioners occasionally import the wrong assumptions. Good project risk training now emphasizes the distinction.
In portfolios and programs, decision trees increasingly appear next to other tools rather than alone. A portfolio governance board might use a decision tree for a funding decision, a Monte Carlo schedule model for delivery confidence, and an influence diagram for strategic risk mapping. The decision tree remains valuable because it is simple enough for stakeholders to follow yet structured enough to support hard choices.
